2038, 1430, 1160, 980, 216
By Column: Everything | Demographics | Sexual History | Attitudes | Relationships | Dating | Hookups
Alphabetically: Everything | Demographics | Sexual History | Attitudes | Relationships | Dating | Hookups
state.graduated.high.school (in Demographics)
| Variable Summary | Undergrad | Freshman | Sophomore | Junior | Senior |
| Sexually active students: | Undergrad | Freshman | Sophomore | Junior | Senior |
| Casual-sexually active students: | Undergrad | Freshman | Sophomore | Junior | Senior |
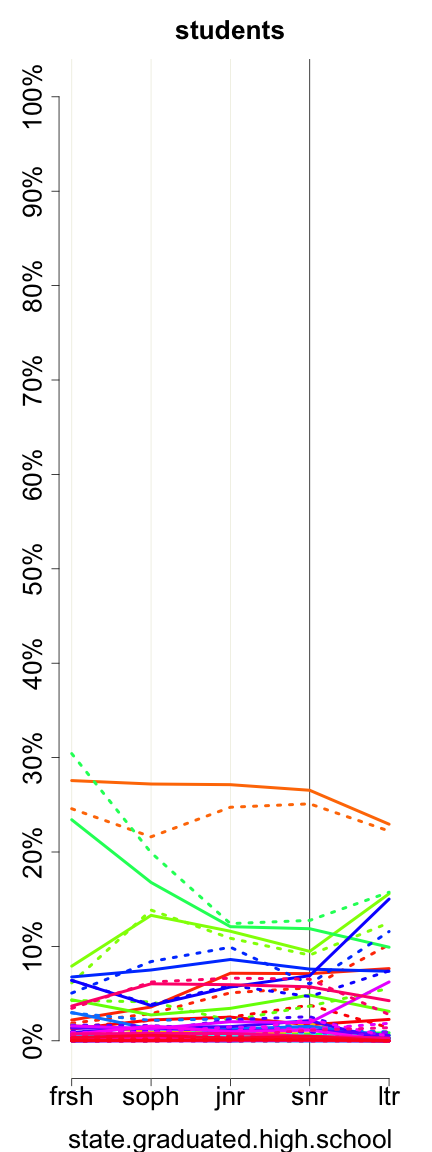
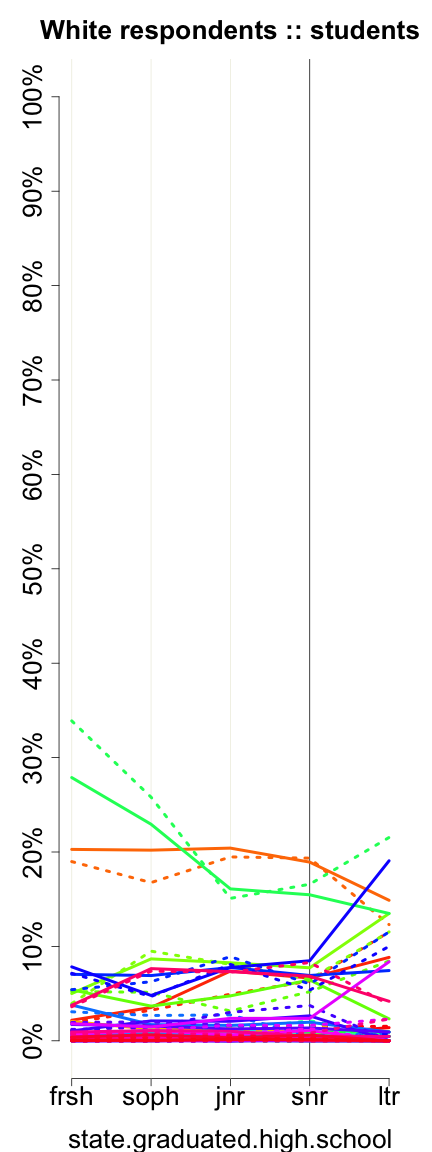
What state did you graduate from high school in?
| students (state_graduated_high_school) | ||||||
| All Rs | Female | Male | ||||
| Alabama | 1036 | 4.30% | 623 | 3.78% | 310 | 4.16% |
| Alaska | 50 | 0.21% | 37 | 0.22% | 13 | 0.17% |
| Arizona | 980 | 4.07% | 708 | 4.30% | 271 | 3.63% |
| Arkansas | 18 | 0.07% | 12 | 0.07% | 6 | 0.08% |
| California | 7498 | 31.11% | 5277 | 32.04% | 2196 | 29.44% |
| Colorado | 157 | 0.65% | 90 | 0.55% | 66 | 0.88% |
| Connecticut | 250 | 1.04% | 155 | 0.94% | 95 | 1.27% |
| Delaware | 13 | 0.05% | 10 | 0.06% | 3 | 0.04% |
| Florida | 120 | 0.50% | 77 | 0.47% | 40 | 0.54% |
| Georgia | 74 | 0.31% | 46 | 0.28% | 28 | 0.38% |
| Hawaii | 66 | 0.27% | 53 | 0.32% | 13 | 0.17% |
| Idaho | 66 | 0.27% | 47 | 0.29% | 19 | 0.25% |
| Illinois | 2182 | 9.05% | 1529 | 9.28% | 647 | 8.67% |
| Indiana | 794 | 3.29% | 547 | 3.32% | 247 | 3.31% |
| Iowa | 19 | 0.08% | 11 | 0.07% | 7 | 0.09% |
| Kansas | 24 | 0.10% | 15 | 0.09% | 9 | 0.12% |
| Kentucky | 31 | 0.13% | 23 | 0.14% | 7 | 0.09% |
| Louisiana | 15 | 0.06% | 10 | 0.06% | 5 | 0.07% |
| Maine | 57 | 0.24% | 42 | 0.26% | 15 | 0.20% |
| Maryland | 137 | 0.57% | 88 | 0.53% | 49 | 0.66% |
| Massachusetts | 3838 | 15.93% | 2495 | 15.15% | 1332 | 17.86% |
| Michigan | 90 | 0.37% | 63 | 0.38% | 26 | 0.35% |
| Minnesota | 120 | 0.50% | 72 | 0.44% | 48 | 0.64% |
| Mississippi | 18 | 0.07% | 10 | 0.06% | 8 | 0.11% |
| Missouri | 98 | 0.41% | 61 | 0.37% | 37 | 0.50% |
| Montana | 116 | 0.48% | 82 | 0.50% | 34 | 0.46% |
| Nebraska | 13 | 0.05% | 7 | 0.04% | 6 | 0.08% |
| Nevada | 51 | 0.21% | 31 | 0.19% | 20 | 0.27% |
| New Hampshire | 86 | 0.36% | 57 | 0.35% | 28 | 0.38% |
| New jersey | 421 | 1.75% | 278 | 1.69% | 142 | 1.90% |
| New Mexico | 37 | 0.15% | 23 | 0.14% | 14 | 0.19% |
| New York | 1598 | 6.63% | 1104 | 6.70% | 489 | 6.56% |
| North Carolina | 41 | 0.17% | 25 | 0.15% | 16 | 0.21% |
| North Dakota | 8 | 0.03% | 4 | 0.02% | 4 | 0.05% |
| Ohio | 1250 | 5.19% | 878 | 5.33% | 371 | 4.97% |
| Oklahoma | 20 | 0.08% | 9 | 0.05% | 11 | 0.15% |
| Oregon | 275 | 1.14% | 186 | 1.13% | 88 | 1.18% |
| Pennsylvania | 271 | 1.12% | 181 | 1.10% | 90 | 1.21% |
| Rhode island | 64 | 0.27% | 41 | 0.25% | 23 | 0.31% |
| South Carolina | 10 | 0.04% | 5 | 0.03% | 5 | 0.07% |
| South Dakota | 9 | 0.04% | 5 | 0.03% | 4 | 0.05% |
| Tennessee | 397 | 1.65% | 302 | 1.83% | 94 | 1.26% |
| Texas | 236 | 0.98% | 154 | 0.94% | 80 | 1.07% |
| Utah | 51 | 0.21% | 32 | 0.19% | 19 | 0.25% |
| Vermont | 51 | 0.21% | 37 | 0.22% | 13 | 0.17% |
| Virginia | 159 | 0.66% | 108 | 0.66% | 51 | 0.68% |
| Washington | 1073 | 4.45% | 732 | 4.44% | 336 | 4.50% |
| West Virginia | 11 | 0.05% | 10 | 0.06% | 1 | 0.01% |
| Wisconsin | 87 | 0.36% | 67 | 0.41% | 20 | 0.27% |
| Wyoming | 12 | 0.05% | 9 | 0.05% | 3 | 0.04% |
| Missing |
33
(0.14%) |
– |
11
(0.07%) |
– |
2
(0.03%) |
– |
| Total | 24131 | 100% | 16479 | 100% | 7461 | 100% |
|
| Alabama Alaska Arizona Arkansas California Colorado Connecticut Delaware Florida Georgia Hawaii Idaho Illinois Indiana Iowa Kansas Kentucky Louisiana Maine Maryland Massachusetts Michigan Minnesota Mississippi Missouri Montana Nebraska Nevada New Hampshire New jersey New Mexico New York North Carolina North Dakota Ohio Oklahoma Oregon Pennsylvania Rhode island South Carolina South Dakota Tennessee Texas Utah Vermont Virginia Washington West Virginia Wisconsin Wyoming |
|
5133, 3213, 2473, 2291, 353
2038, 1430, 1160, 980, 216 |
 |
| Alabama Alaska Arizona Arkansas California Colorado Connecticut Delaware Florida Georgia Hawaii Idaho Illinois Indiana Iowa Kansas Kentucky Louisiana Maine Maryland Massachusetts Michigan Minnesota Mississippi Missouri Montana Nebraska Nevada New Hampshire New jersey New Mexico New York North Carolina North Dakota Ohio Oklahoma Oregon Pennsylvania Rhode island South Carolina South Dakota Tennessee Texas Utah Vermont Virginia Washington West Virginia Wisconsin Wyoming |
|
3536, 2040, 1597, 1474, 215
1496, 895, 729, 615, 130 |
These graphs reflect only undergraduates attending 4-year colleges who are of normative age -- 18, 19, 20, 21, or 22, +/- 1, for freshman, sophomores, juniors, seniors, and later undergraduates, respectively. Solid lines represent women. Dotted lines represent men.
Previous column:
major
Next column:
gpa
Previous alphabetically:
south.asian
Next alphabetically:
still.together