1892, 1292, 1010, 859, 177
By Column: Everything | Demographics | Sexual History | Attitudes | Relationships | Dating | Hookups
Alphabetically: Everything | Demographics | Sexual History | Attitudes | Relationships | Dating | Hookups
major (in Demographics)
| Variable Summary | Undergrad | Freshman | Sophomore | Junior | Senior |
| Sexually active students: | Undergrad | Freshman | Sophomore | Junior | Senior |
| Casual-sexually active students: | Undergrad | Freshman | Sophomore | Junior | Senior |
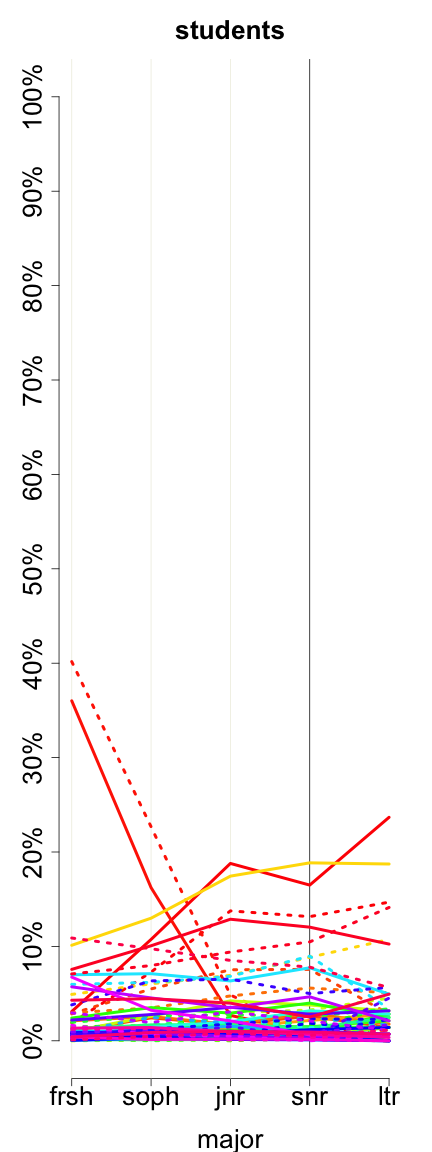
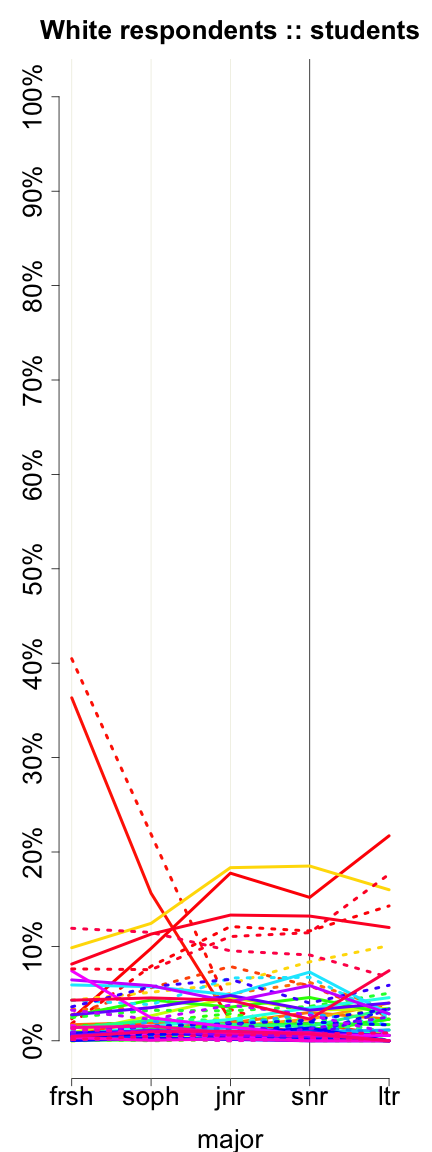
What is your major?
| students (major) | ||||||
| All Rs | Female | Male | ||||
| Sociology | 2105 | 10.15% | 1544 | 10.92% | 558 | 8.65% |
| Undecided | 3949 | 19.03% | 2522 | 17.83% | 1320 | 20.45% |
| Economics | 561 | 2.70% | 240 | 1.70% | 319 | 4.94% |
| Political science | 553 | 2.67% | 310 | 2.19% | 242 | 3.75% |
| Anthropology | 206 | 0.99% | 167 | 1.18% | 39 | 0.60% |
| Psychology | 2443 | 11.77% | 1984 | 14.03% | 454 | 7.03% |
| Public policy/affairs | 69 | 0.33% | 38 | 0.27% | 31 | 0.48% |
| Social science other | 486 | 2.34% | 357 | 2.52% | 128 | 1.98% |
| Ethnic studies African American latino | 56 | 0.27% | 47 | 0.33% | 9 | 0.14% |
| Area studies latin America etc | 49 | 0.24% | 38 | 0.27% | 11 | 0.17% |
| Womens/gender/feminist studies | 124 | 0.60% | 108 | 0.76% | 10 | 0.15% |
| English or comp lit | 510 | 2.46% | 400 | 2.83% | 109 | 1.69% |
| Language/literature French Spanish etc | 172 | 0.83% | 130 | 0.92% | 40 | 0.62% |
| History | 325 | 1.57% | 158 | 1.12% | 166 | 2.57% |
| Philosophy | 106 | 0.51% | 34 | 0.24% | 72 | 1.12% |
| Art or design | 317 | 1.53% | 221 | 1.56% | 96 | 1.49% |
| Music | 100 | 0.48% | 59 | 0.42% | 41 | 0.64% |
| Other humanities | 289 | 1.39% | 211 | 1.49% | 75 | 1.16% |
| Biology | 1336 | 6.44% | 947 | 6.70% | 388 | 6.01% |
| Chemistry | 250 | 1.20% | 146 | 1.03% | 103 | 1.60% |
| Physics | 71 | 0.34% | 18 | 0.13% | 53 | 0.82% |
| Earth sciences | 90 | 0.43% | 60 | 0.42% | 30 | 0.46% |
| Other natural sciences | 166 | 0.80% | 113 | 0.80% | 52 | 0.81% |
| Math or statistics | 141 | 0.68% | 82 | 0.58% | 59 | 0.91% |
| Computer science | 118 | 0.57% | 21 | 0.15% | 97 | 1.50% |
| Engineering | 422 | 2.03% | 104 | 0.74% | 315 | 4.88% |
| Education | 441 | 2.13% | 381 | 2.69% | 59 | 0.91% |
| Physical education, exercise science, etc | 126 | 0.61% | 72 | 0.51% | 54 | 0.84% |
| Journalism or communication | 785 | 3.78% | 628 | 4.44% | 156 | 2.42% |
| Nursing | 682 | 3.29% | 611 | 4.32% | 68 | 1.05% |
| Pharmacology | 47 | 0.23% | 35 | 0.25% | 12 | 0.19% |
| Other medical | 302 | 1.46% | 215 | 1.52% | 87 | 1.35% |
| Social work | 157 | 0.76% | 127 | 0.90% | 29 | 0.45% |
| Business | 1182 | 5.70% | 571 | 4.04% | 608 | 9.42% |
| Other not listed | 2013 | 9.70% | 1445 | 10.22% | 564 | 8.74% |
| Missing |
3382
(14.02%) |
– |
2335
(14.17%) |
– |
1007
(13.50%) |
– |
| Total | 24131 | 100% | 16479 | 100% | 7461 | 100% |
|
| Sociology Undecided Economics Political science Anthropology Psychology Public policy/affairs Social science other Ethnic studies African American latino Area studies latin America etc Womens/gender/feminist studies English or comp lit Language/literature French Spanish etc History Philosophy Art or design Music Other humanities Biology Chemistry Physics Earth sciences Other natural sciences Math or statistics Computer science Engineering Education Physical education, exercise science, etc Journalism or communication Nursing Pharmacology Other medical Social work Business Other not listed |
|
4773, 2841, 2081, 1952, 283
1892, 1292, 1010, 859, 177 |
 |
| Sociology Undecided Economics Political science Anthropology Psychology Public policy/affairs Social science other Ethnic studies African American latino Area studies latin America etc Womens/gender/feminist studies English or comp lit Language/literature French Spanish etc History Philosophy Art or design Music Other humanities Biology Chemistry Physics Earth sciences Other natural sciences Math or statistics Computer science Engineering Education Physical education, exercise science, etc Journalism or communication Nursing Pharmacology Other medical Social work Business Other not listed |
|
3347, 1849, 1374, 1264, 175
1418, 836, 661, 550, 119 |
These graphs reflect only undergraduates attending 4-year colleges who are of normative age -- 18, 19, 20, 21, or 22, +/- 1, for freshman, sophomores, juniors, seniors, and later undergraduates, respectively. Solid lines represent women. Dotted lines represent men.
Previous column:
lives.on.or.off.campus
Next column:
state.graduated.high.school
Previous alphabetically:
lives.with.parents
Next alphabetically:
malts