2034, 1421, 1149, 970, 215
By Column: Everything | Demographics | Sexual History | Attitudes | Relationships | Dating | Hookups
Alphabetically: Everything | Demographics | Sexual History | Attitudes | Relationships | Dating | Hookups
population.density.during.high.school (in Demographics)
| Variable Summary | Undergrad | Freshman | Sophomore | Junior | Senior |
| Sexually active students: | Undergrad | Freshman | Sophomore | Junior | Senior |
| Casual-sexually active students: | Undergrad | Freshman | Sophomore | Junior | Senior |
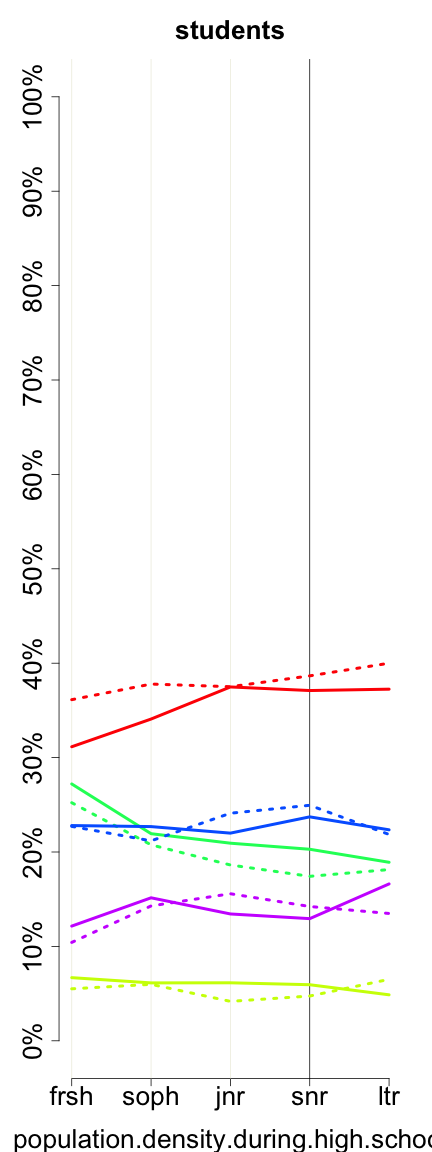
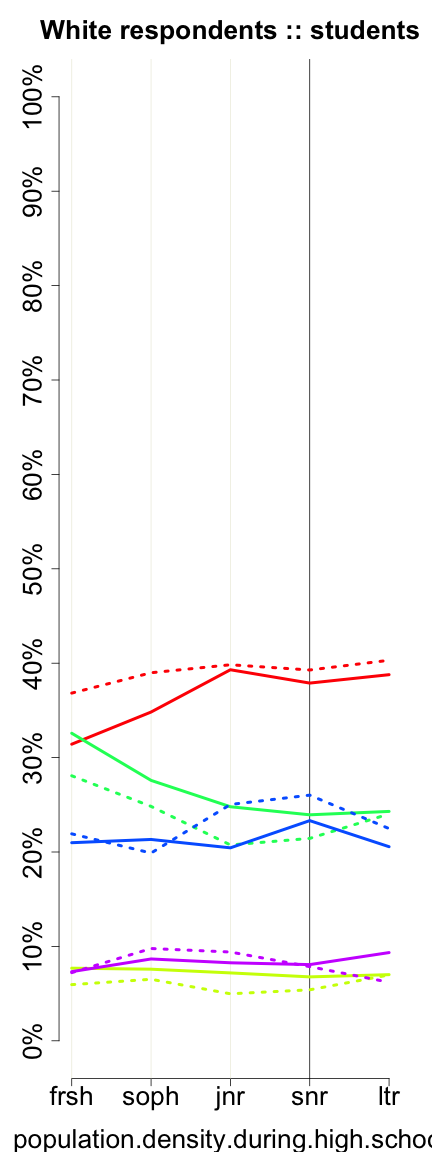
What kind of community did you go to high school in?
| students (p_d_d_h_s) | ||||||
| All Rs | Female | Male | ||||
| Suburb | 8215 | 34.52% | 5477 | 33.54% | 2708 | 36.62% |
| Rural | 1379 | 5.79% | 970 | 5.94% | 403 | 5.45% |
| Small town | 5196 | 21.83% | 3679 | 22.53% | 1511 | 20.44% |
| Medium city | 5717 | 24.02% | 3919 | 24.00% | 1779 | 24.06% |
| Large city | 3292 | 13.83% | 2285 | 13.99% | 993 | 13.43% |
| Missing |
332
(1.38%) |
– |
149
(0.90%) |
– |
67
(0.90%) |
– |
| Total | 24131 | 100% | 16479 | 100% | 7461 | 100% |
|
| Suburb Rural Small town Medium city Large city |
|
5127, 3195, 2441, 2272, 349
2034, 1421, 1149, 970, 215 |
 |
| Suburb Rural Small town Medium city Large city |
|
3536, 2030, 1585, 1462, 214
1496, 890, 723, 611, 129 |
These graphs reflect only undergraduates attending 4-year colleges who are of normative age -- 18, 19, 20, 21, or 22, +/- 1, for freshman, sophomores, juniors, seniors, and later undergraduates, respectively. Solid lines represent women. Dotted lines represent men.
Previous column:
country.of.origin
Next column:
mothers.education
Previous alphabetically:
political.views
Next alphabetically:
pressured