2024, 1416, 1150, 966, 214
1180, 919, 787, 710, 167
668, 571, 527, 448, 125
485, 532, 593, 570, 142
By Column: Everything | Demographics | Sexual History | Attitudes | Relationships | Dating | Hookups
Alphabetically: Everything | Demographics | Sexual History | Attitudes | Relationships | Dating | Hookups
pressured (in Dating, Hookups, Relationships and Sexual History)
| Variable Summary | Undergrad | Freshman | Sophomore | Junior | Senior |
| Sexually active students: | Undergrad | Freshman | Sophomore | Junior | Senior |
| Casual-sexually active students: | Undergrad | Freshman | Sophomore | Junior | Senior |
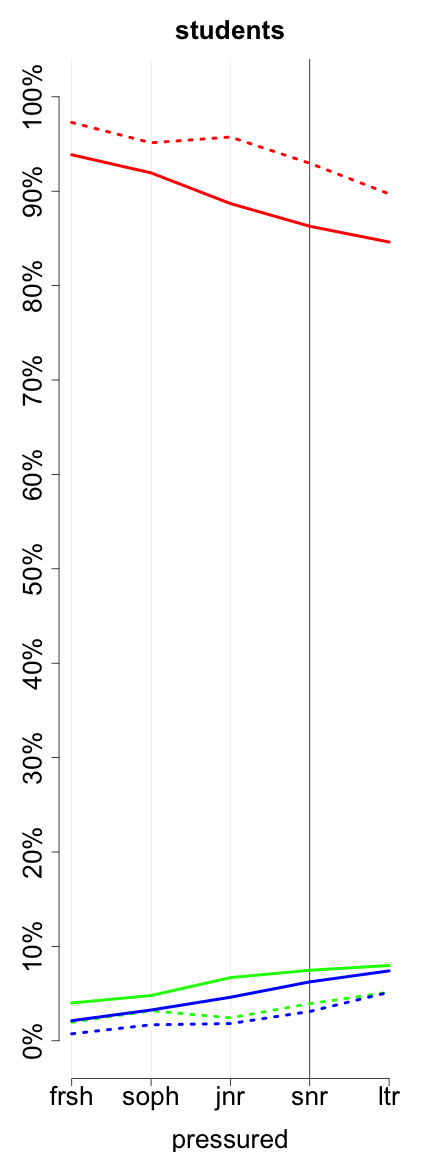
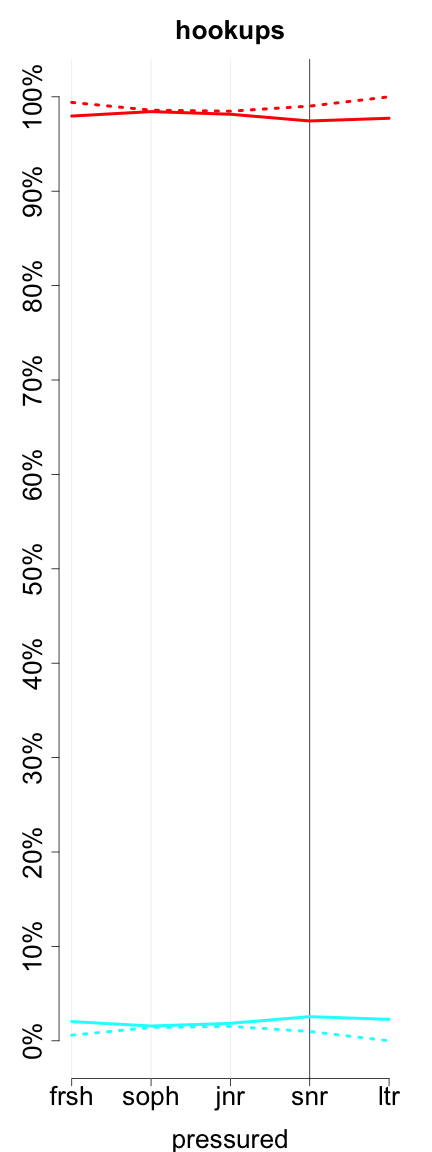
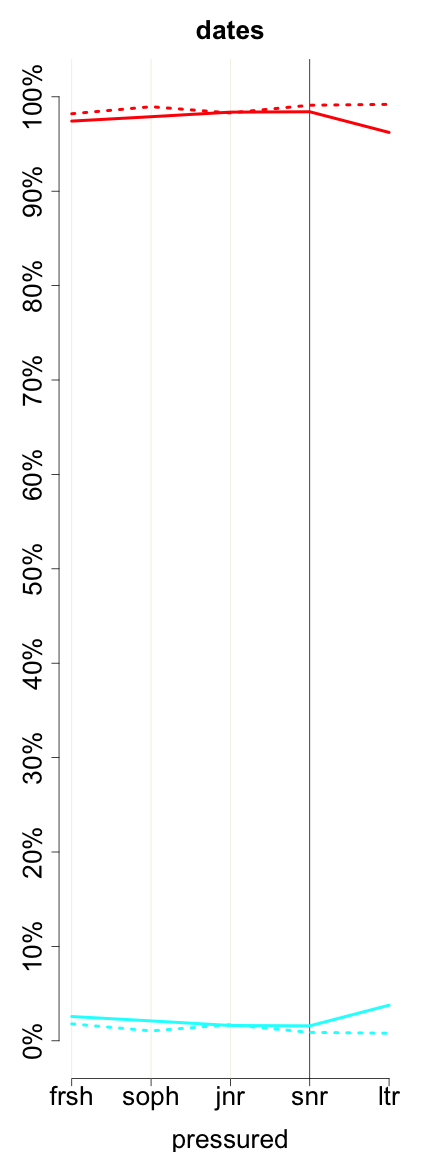
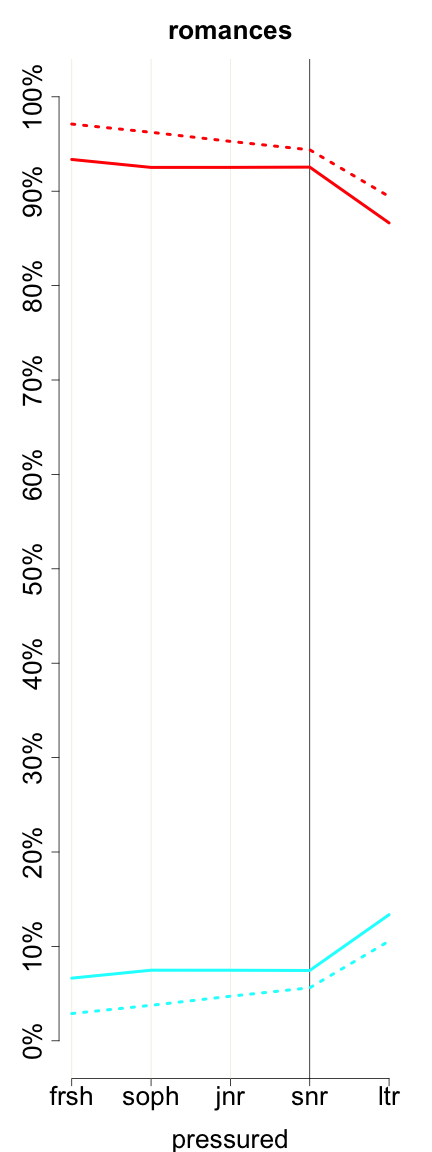
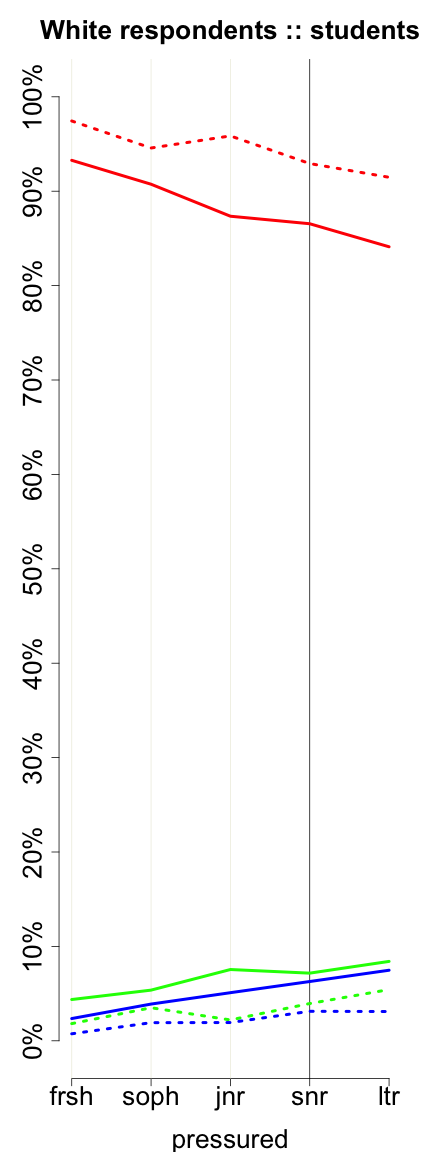
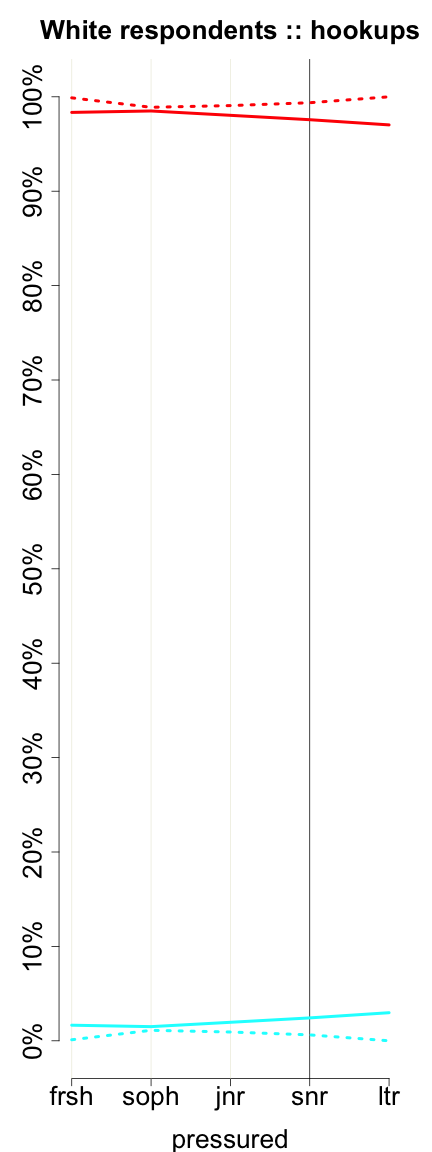
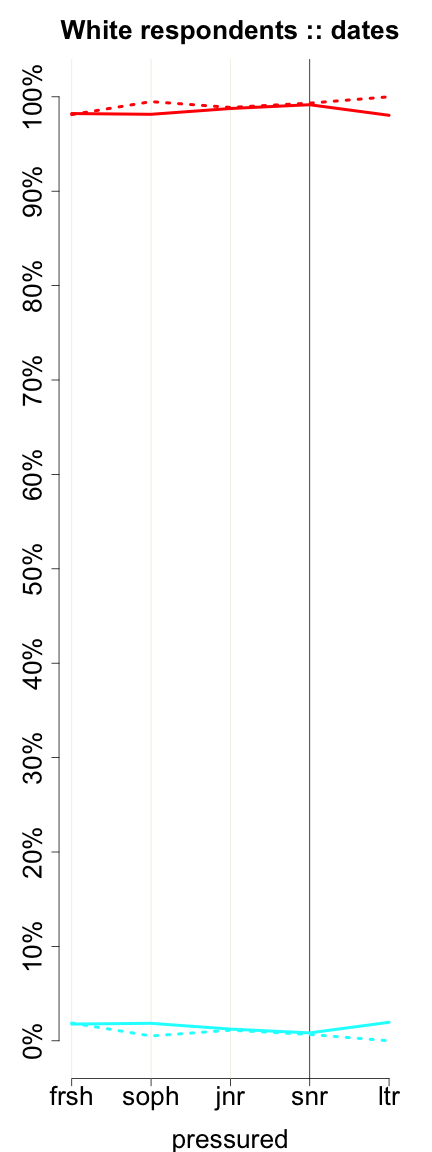
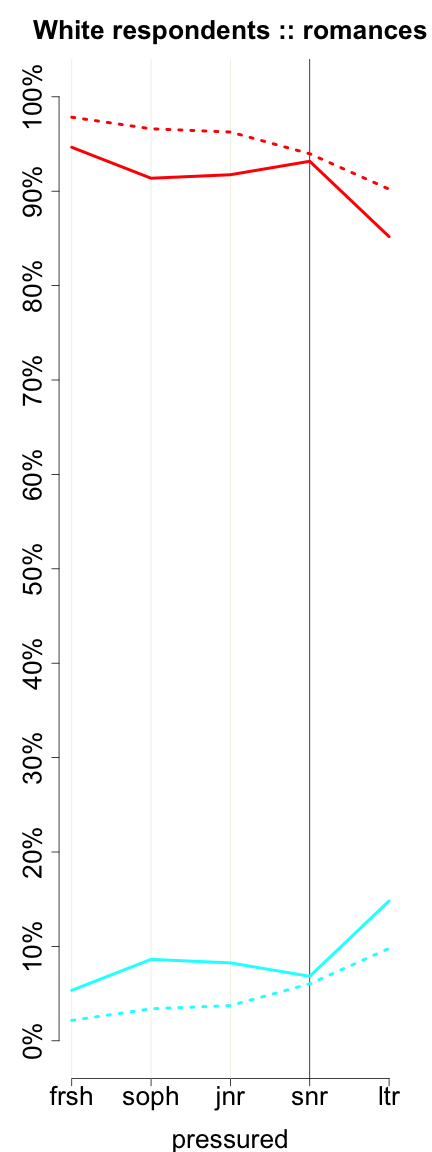
‘Since you started college, have you had sexual intercourse that you did not want because someone verbally pressured you?’ or, during your most recent date/hookup/relationship, ‘Did you have sexual intercourse that you did not want because someone verbally pressured you?’ At the student-level, as it pertains to this event, Where had the two of you been before the incident? (the most recent one if more than one), and When did this happen? I was a...
The same question also applies to the variables, pressured..location.before.incident, and pressured..when.did.this.happen.
| students (ever..pressured) (ever__pressured) | ||||||
| All Rs | Female | Male | ||||
| No | 21976 | 92.18% | 14847 | 90.77% | 7048 | 95.39% |
| Once | 1112 | 4.66% | 894 | 5.47% | 211 | 2.86% |
| More than once | 752 | 3.15% | 616 | 3.77% | 130 | 1.76% |
| Missing |
291
(1.21%) |
– |
122
(0.74%) |
– |
72
(0.97%) |
– |
| Total | 24131 | 100% | 16479 | 100% | 7461 | 100% |
| hookups (pressured or hookup__pressured) | ||||||
| All Rs | Female | Male | ||||
| Mean (Std. Dev.) | 0.02 (0.13) | 0.02 (0.14) | 0.01 (0.11) | |||
| 0 | 14339 | 98.25% | 9628 | 98.03% | 4660 | 98.81% |
| 1 | 255 | 1.75% | 193 | 1.97% | 56 | 1.19% |
| Missing |
155
(1.05%) |
– |
98
(0.99%) |
– |
55
(1.15%) |
– |
| Total | 14749 | 100% | 9919 | 100% | 4771 | 100% |
| dates (pressured or date__pressured) | ||||||
| All Rs | Female | Male | ||||
| Mean (Std. Dev.) | 0.02 (0.14) | 0.02 (0.15) | 0.02 (0.13) | |||
| 0 | 8715 | 97.97% | 5683 | 97.83% | 3003 | 98.30% |
| 1 | 181 | 2.03% | 126 | 2.17% | 52 | 1.70% |
| Missing |
5593
(38.60%) |
– |
3917
(40.27%) |
– |
1652
(35.10%) |
– |
| Total | 14489 | 100% | 9726 | 100% | 4707 | 100% |
| romances (pressured or romance__pressured) | ||||||
| All Rs | Female | Male | ||||
| Mean (Std. Dev.) | 0.07 (0.25) | 0.07 (0.26) | 0.04 (0.21) | |||
| 0 | 11336 | 93.31% | 8231 | 92.51% | 3065 | 95.51% |
| 1 | 813 | 6.69% | 666 | 7.49% | 144 | 4.49% |
| Missing |
143
(1.16%) |
– |
88
(0.98%) |
– |
51
(1.56%) |
– |
| Total | 12292 | 100% | 8985 | 100% | 3260 | 100% |
|
|
|
|
| students: No Once More than once | |||
| hookups: Negative (no/false) Positive (yes/true) | |||
| dates: Negative (no/false) Positive (yes/true) | |||
| romances: Negative (no/false) Positive (yes/true) | |||
|
5115, 3189, 2450, 2275, 351
2024, 1416, 1150, 966, 214 |
2698, 1978, 1677, 1641, 264
1180, 919, 787, 710, 167 |
1399, 1138, 1047, 1010, 159
668, 571, 527, 448, 125 |
1763, 1591, 1605, 1638, 262
485, 532, 593, 570, 142 |
 |
 |
 |
 |
| students: No Once More than once | |||
| hookups: Negative (no/false) Positive (yes/true) | |||
| dates: Negative (no/false) Positive (yes/true) | |||
| romances: Negative (no/false) Positive (yes/true) | |||
|
3522, 2030, 1589, 1465, 214
1484, 885, 724, 608, 129 |
2057, 1400, 1173, 1113, 168
913, 630, 537, 478, 106 |
1015, 809, 726, 715, 102
530, 390, 356, 298, 77 |
1216, 1020, 1066, 1069, 162
370, 354, 402, 381, 92 |
These graphs reflect only undergraduates attending 4-year colleges who are of normative age -- 18, 19, 20, 21, or 22, +/- 1, for freshman, sophomores, juniors, seniors, and later undergraduates, respectively. Solid lines represent women. Dotted lines represent men.
Previous column:
incapacitated..when.did.this.happen
Next column:
pressured..location.before.incident
Previous alphabetically:
population.density.during.high.school
Next alphabetically:
pressured..location.before.incident