1822, 1281, 1039, 865, 203
By Column: Everything | Demographics | Sexual History | Attitudes | Relationships | Dating | Hookups
Alphabetically: Everything | Demographics | Sexual History | Attitudes | Relationships | Dating | Hookups
political.views (in Attitudes)
| Variable Summary | Undergrad | Freshman | Sophomore | Junior | Senior |
| Sexually active students: | Undergrad | Freshman | Sophomore | Junior | Senior |
| Casual-sexually active students: | Undergrad | Freshman | Sophomore | Junior | Senior |
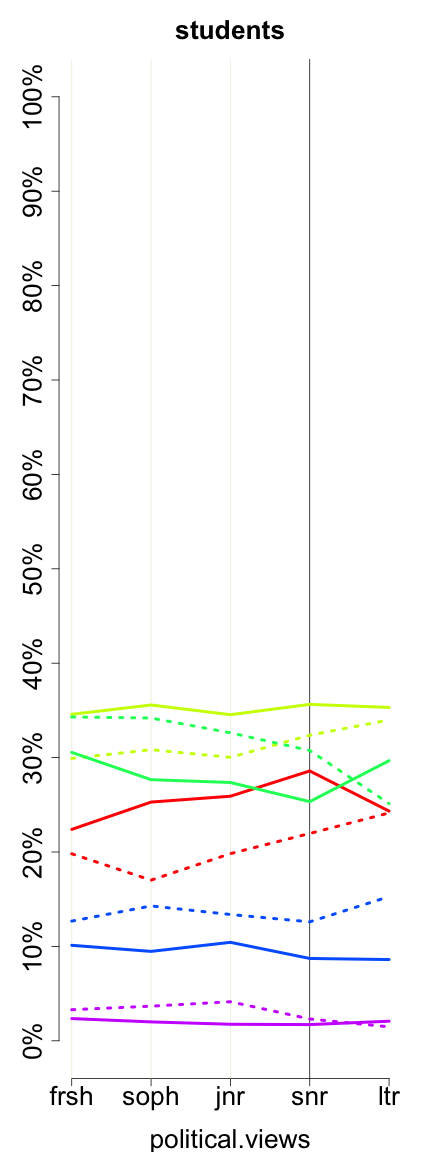
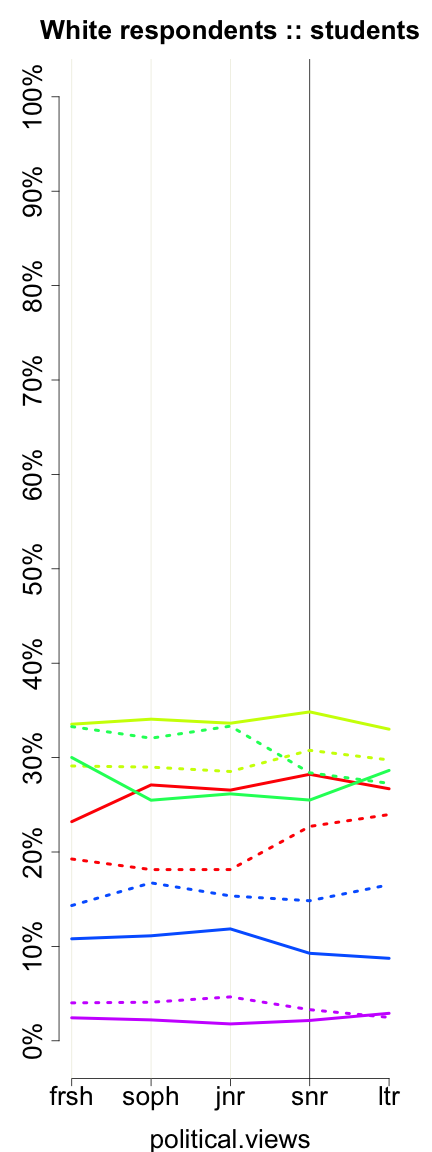
How would you characterize your political views?
| students (political_views) | ||||||
| All Rs | Female | Male | ||||
| Very liberal | 5088 | 23.05% | 3735 | 24.52% | 1326 | 19.66% |
| Somewhat liberal | 7376 | 33.42% | 5291 | 34.73% | 2056 | 30.48% |
| Middle of the road | 6718 | 30.44% | 4415 | 28.98% | 2279 | 33.79% |
| Somewhat conservative | 2355 | 10.67% | 1478 | 9.70% | 868 | 12.87% |
| Very conservative | 533 | 2.42% | 316 | 2.07% | 216 | 3.20% |
| Missing |
2061
(8.54%) |
– |
1244
(7.55%) |
– |
716
(9.60%) |
– |
| Total | 24131 | 100% | 16479 | 100% | 7461 | 100% |
|
| Very liberal Somewhat liberal Middle of the road Somewhat conservative Very conservative |
|
4586, 2946, 2339, 2155, 337
1822, 1281, 1039, 865, 203 |
 |
| Very liberal Somewhat liberal Middle of the road Somewhat conservative Very conservative |
|
3119, 1852, 1510, 1392, 206
1319, 783, 645, 546, 121 |
These graphs reflect only undergraduates attending 4-year colleges who are of normative age -- 18, 19, 20, 21, or 22, +/- 1, for freshman, sophomores, juniors, seniors, and later undergraduates, respectively. Solid lines represent women. Dotted lines represent men.
Previous column:
party.identification.specify
Next column:
ideal.age.to.marry
Previous alphabetically:
physattr.normed.within.sex
Next alphabetically:
population.density.during.high.school