2038, 1430, 1160, 980, 216
By Column: Everything | Demographics | Sexual History | Attitudes | Relationships | Dating | Hookups
Alphabetically: Everything | Demographics | Sexual History | Attitudes | Relationships | Dating | Hookups
ideal.age.to.marry (in Attitudes)
| Variable Summary | Undergrad | Freshman | Sophomore | Junior | Senior |
| Sexually active students: | Undergrad | Freshman | Sophomore | Junior | Senior |
| Casual-sexually active students: | Undergrad | Freshman | Sophomore | Junior | Senior |
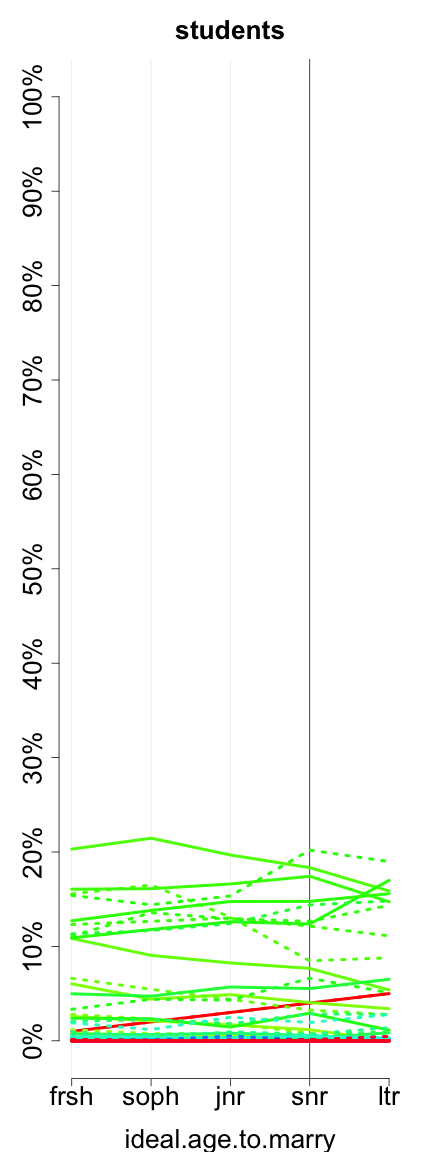
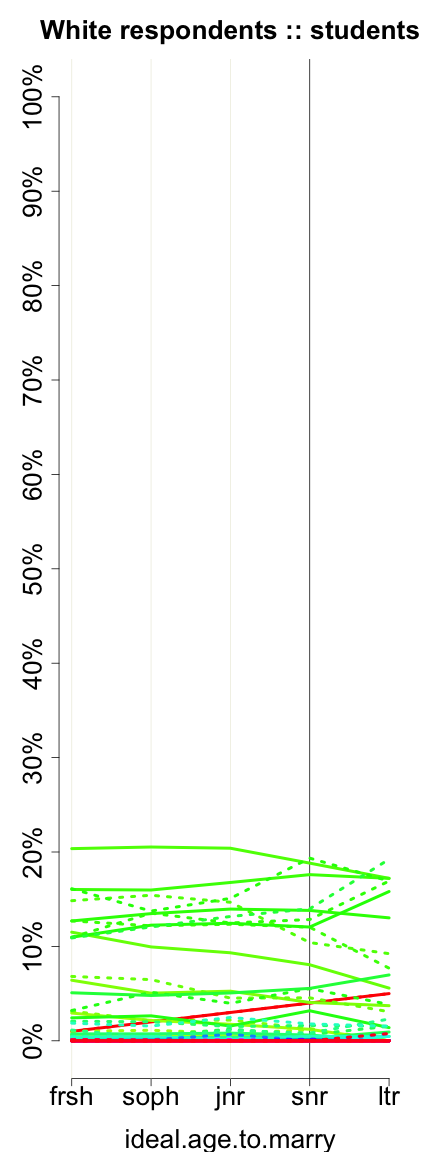
How old would you ideally like to be when you get married?
| students (ideal_age_to_marry) | ||||||
| All Rs | Female | Male | ||||
| 3669 | 15.20% | 2377 | 14.42% | 1174 | 15.74% | |
| ? | 23 | 0.10% | 15 | 0.09% | 8 | 0.11% |
| ?? | 4 | 0.02% | 4 | 0.02% | 0 | 0.00% |
| 0 | 1 | 0.00% | 1 | 0.01% | 0 | 0.00% |
| 1 | 2 | 0.01% | 2 | 0.01% | 0 | 0.00% |
| 12 | 2 | 0.01% | 1 | 0.01% | 1 | 0.01% |
| 13 | 1 | 0.00% | 0 | 0.00% | 1 | 0.01% |
| 14 | 2 | 0.01% | 0 | 0.00% | 2 | 0.03% |
| 18 | 3 | 0.01% | 1 | 0.01% | 2 | 0.03% |
| 19 | 5 | 0.02% | 4 | 0.02% | 0 | 0.00% |
| 2 | 8 | 0.03% | 4 | 0.02% | 4 | 0.05% |
| 20 | 39 | 0.16% | 29 | 0.18% | 10 | 0.13% |
| 21 | 105 | 0.44% | 96 | 0.58% | 9 | 0.12% |
| 22 | 370 | 1.53% | 301 | 1.83% | 67 | 0.90% |
| 23 | 882 | 3.66% | 740 | 4.49% | 141 | 1.89% |
| 24 | 1744 | 7.23% | 1400 | 8.50% | 334 | 4.48% |
| 25 | 4009 | 16.61% | 3059 | 18.56% | 940 | 12.60% |
| 26 | 3328 | 13.79% | 2480 | 15.05% | 841 | 11.27% |
| 27 | 3060 | 12.68% | 2181 | 13.24% | 868 | 11.63% |
| 28 | 3103 | 12.86% | 1955 | 11.86% | 1138 | 15.25% |
| 29 | 735 | 3.05% | 408 | 2.48% | 324 | 4.34% |
| 3 | 7 | 0.03% | 6 | 0.04% | 1 | 0.01% |
| 30 | 1913 | 7.93% | 937 | 5.69% | 965 | 12.93% |
| 31 | 102 | 0.42% | 48 | 0.29% | 54 | 0.72% |
| 32 | 327 | 1.36% | 143 | 0.87% | 183 | 2.45% |
| 33 | 137 | 0.57% | 59 | 0.36% | 78 | 1.05% |
| 34 | 55 | 0.23% | 23 | 0.14% | 32 | 0.43% |
| 35 | 291 | 1.21% | 108 | 0.66% | 180 | 2.41% |
| 36 | 28 | 0.12% | 10 | 0.06% | 18 | 0.24% |
| 37 | 20 | 0.08% | 8 | 0.05% | 12 | 0.16% |
| 38 | 17 | 0.07% | 10 | 0.06% | 7 | 0.09% |
| 39 | 12 | 0.05% | 8 | 0.05% | 4 | 0.05% |
| 4 | 5 | 0.02% | 4 | 0.02% | 1 | 0.01% |
| 40 | 50 | 0.21% | 17 | 0.10% | 32 | 0.43% |
| 41 | 1 | 0.00% | 1 | 0.01% | 0 | 0.00% |
| 42 | 5 | 0.02% | 2 | 0.01% | 3 | 0.04% |
| 44 | 1 | 0.00% | 0 | 0.00% | 1 | 0.01% |
| 45 | 11 | 0.05% | 8 | 0.05% | 3 | 0.04% |
| 46 | 3 | 0.01% | 0 | 0.00% | 3 | 0.04% |
| 47 | 1 | 0.00% | 0 | 0.00% | 1 | 0.01% |
| 48 | 4 | 0.02% | 4 | 0.02% | 0 | 0.00% |
| 49 | 1 | 0.00% | 1 | 0.01% | 0 | 0.00% |
| 5 | 2 | 0.01% | 1 | 0.01% | 1 | 0.01% |
| 50 | 10 | 0.04% | 8 | 0.05% | 2 | 0.03% |
| 52 | 3 | 0.01% | 3 | 0.02% | 0 | 0.00% |
| 54 | 3 | 0.01% | 3 | 0.02% | 0 | 0.00% |
| 55 | 5 | 0.02% | 3 | 0.02% | 1 | 0.01% |
| 58 | 1 | 0.00% | 0 | 0.00% | 1 | 0.01% |
| 6 | 1 | 0.00% | 0 | 0.00% | 1 | 0.01% |
| 60 | 3 | 0.01% | 2 | 0.01% | 0 | 0.00% |
| 65 | 2 | 0.01% | 1 | 0.01% | 1 | 0.01% |
| 69 | 1 | 0.00% | 0 | 0.00% | 1 | 0.01% |
| 76 | 1 | 0.00% | 0 | 0.00% | 1 | 0.01% |
| 80 | 1 | 0.00% | 0 | 0.00% | 1 | 0.01% |
| 89 | 1 | 0.00% | 1 | 0.01% | 0 | 0.00% |
| 99 | 6 | 0.02% | 1 | 0.01% | 5 | 0.07% |
| na | 1 | 0.00% | 1 | 0.01% | 0 | 0.00% |
| NA | 4 | 0.02% | 0 | 0.00% | 4 | 0.05% |
| Missing |
0
(0.00%) |
– |
0
(0.00%) |
– |
0
(0.00%) |
– |
| Total | 24131 | 100% | 16479 | 100% | 7461 | 100% |
|
| ? ?? 0 1 12 13 14 18 19 2 20 21 22 23 24 25 26 27 28 29 3 30 31 32 33 34 35 36 37 38 39 4 40 41 42 44 45 46 47 48 49 5 50 52 54 55 58 6 60 65 69 76 80 89 99 na NA |
|
5137, 3215, 2474, 2295, 353
2038, 1430, 1160, 980, 216 |
 |
| ? ?? 0 1 12 13 14 18 19 2 20 21 22 23 24 25 26 27 28 29 3 30 31 32 33 34 35 36 37 38 39 4 40 41 42 44 45 46 47 48 49 5 50 52 54 55 58 6 60 65 69 76 80 89 99 na NA |
|
3537, 2041, 1598, 1477, 215
1496, 895, 729, 615, 130 |
These graphs reflect only undergraduates attending 4-year colleges who are of normative age -- 18, 19, 20, 21, or 22, +/- 1, for freshman, sophomores, juniors, seniors, and later undergraduates, respectively. Solid lines represent women. Dotted lines represent men.
Previous column:
political.views
Next column:
any.children
Previous alphabetically:
ideal.age.for.childbearing
Next alphabetically:
immigrant