2028, 1423, 1152, 977, 212
By Column: Everything | Demographics | Sexual History | Attitudes | Relationships | Dating | Hookups
Alphabetically: Everything | Demographics | Sexual History | Attitudes | Relationships | Dating | Hookups
immigrant (in Demographics)
| Variable Summary | Undergrad | Freshman | Sophomore | Junior | Senior |
| Sexually active students: | Undergrad | Freshman | Sophomore | Junior | Senior |
| Casual-sexually active students: | Undergrad | Freshman | Sophomore | Junior | Senior |
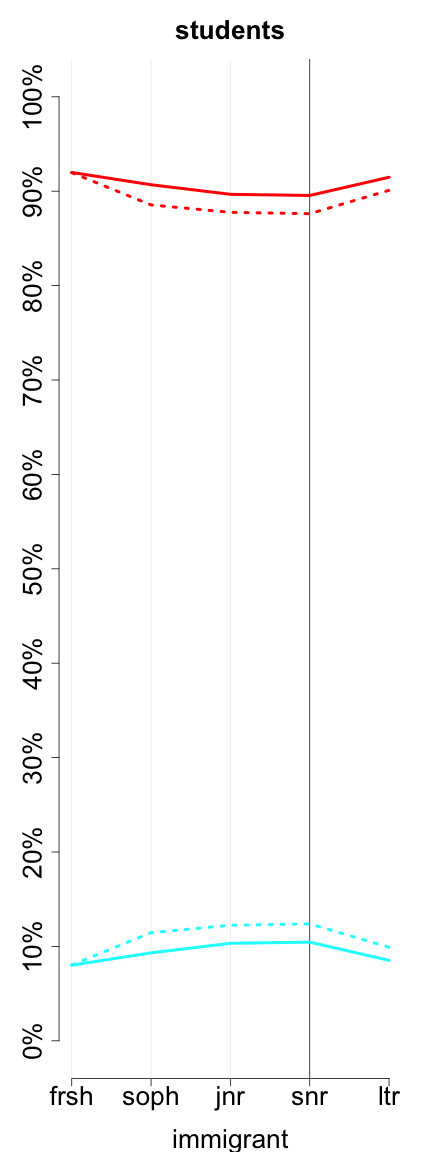
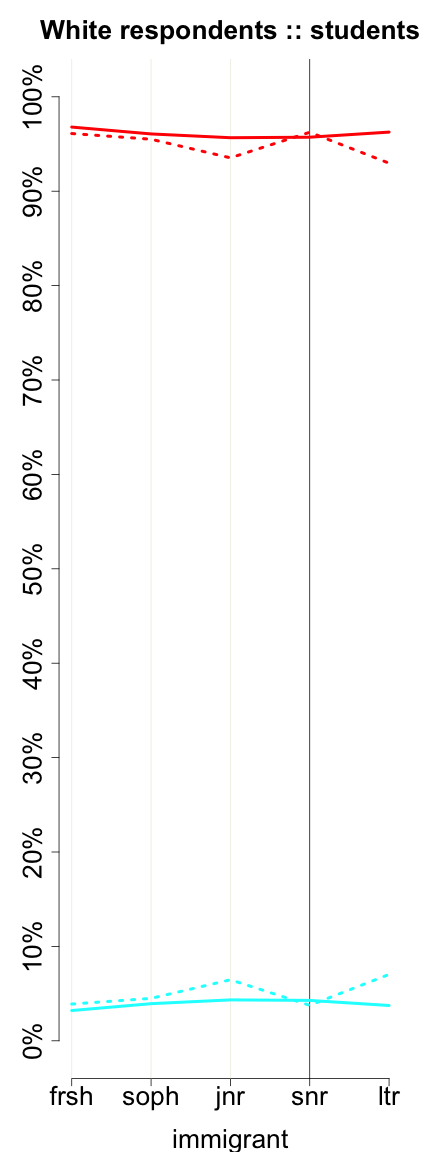
Were you born in the United States (one of the 50 states or Washington DC)?
| students (immigrant) | ||||||
| All Rs | Female | Male | ||||
| Mean (Std. Dev.) | 0.13 (0.33) | 0.12 (0.33) | 0.13 (0.34) | |||
| 0 | 20886 | 87.44% | 14397 | 87.79% | 6424 | 86.66% |
| 1 | 3000 | 12.56% | 2003 | 12.21% | 989 | 13.34% |
| Missing |
245
(1.02%) |
– |
79
(0.48%) |
– |
48
(0.64%) |
– |
| Total | 24131 | 100% | 16479 | 100% | 7461 | 100% |
|
| Negative (no/false) Positive (yes/true) |
|
5116, 3199, 2459, 2287, 352
2028, 1423, 1152, 977, 212 |
 |
| Negative (no/false) Positive (yes/true) |
|
3525, 2034, 1592, 1472, 214
1490, 890, 727, 612, 128 |
These graphs reflect only undergraduates attending 4-year colleges who are of normative age -- 18, 19, 20, 21, or 22, +/- 1, for freshman, sophomores, juniors, seniors, and later undergraduates, respectively. Solid lines represent women. Dotted lines represent men.
Previous column:
race.specify
Next column:
continent.of.origin
Previous alphabetically:
ideal.age.to.marry
Next alphabetically:
incapacitated