2028, 1426, 1160, 977, 216
By Column: Everything | Demographics | Sexual History | Attitudes | Relationships | Dating | Hookups
Alphabetically: Everything | Demographics | Sexual History | Attitudes | Relationships | Dating | Hookups
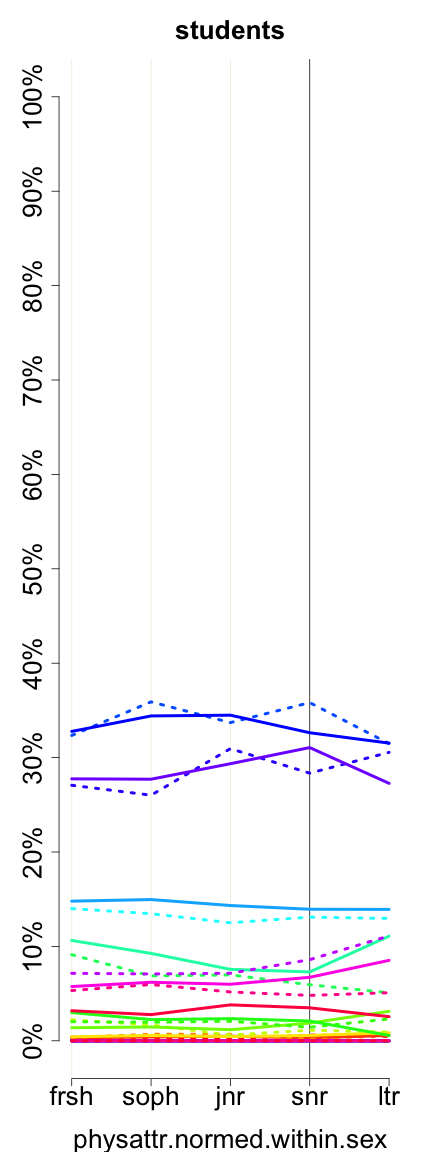
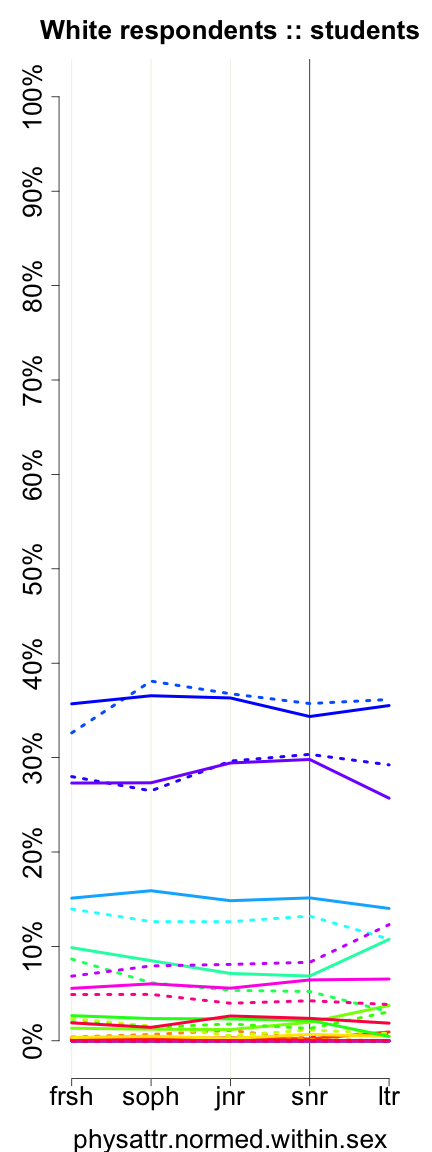
physattr.normed.within.sex
| Variable Summary | Undergrad | Freshman | Sophomore | Junior | Senior |
| Sexually active students: | Undergrad | Freshman | Sophomore | Junior | Senior |
| Casual-sexually active students: | Undergrad | Freshman | Sophomore | Junior | Senior |
This variable, physattr.normed.within.sex, is constructed using information from the variables, physattr and gender.
| students (physattr_normed_within_sex) | ||||||
| All Rs | Female | Male | ||||
| Mean (Std. Dev.) | 0.00 (1.00) | 0.00 (1.00) | -0.00 (1.00) | |||
| -4.12442438575313 | 27 | 0.11% | 0 | 0.00% | 27 | 0.36% |
| -4.08158204942758 | 67 | 0.28% | 67 | 0.41% | 0 | 0.00% |
| -3.45266812775762 | 36 | 0.15% | 0 | 0.00% | 36 | 0.48% |
| -3.40009484140652 | 89 | 0.37% | 89 | 0.54% | 0 | 0.00% |
| -2.78091186976212 | 127 | 0.53% | 0 | 0.00% | 127 | 1.71% |
| -2.71860763338546 | 263 | 1.10% | 263 | 1.60% | 0 | 0.00% |
| -2.10915561176662 | 163 | 0.68% | 0 | 0.00% | 163 | 2.19% |
| -2.0371204253644 | 432 | 1.81% | 432 | 2.63% | 0 | 0.00% |
| -1.43739935377111 | 555 | 2.33% | 0 | 0.00% | 555 | 7.47% |
| -1.35563321734334 | 1557 | 6.52% | 1557 | 9.48% | 0 | 0.00% |
| -0.765643095775612 | 975 | 4.09% | 0 | 0.00% | 975 | 13.12% |
| -0.674146009322276 | 2362 | 9.90% | 2362 | 14.38% | 0 | 0.00% |
| -0.0938868377801087 | 2476 | 10.38% | 0 | 0.00% | 2476 | 33.31% |
| 0.00734119869878457 | 5367 | 22.49% | 5367 | 32.66% | 0 | 0.00% |
| 0.577869420215394 | 2093 | 8.77% | 0 | 0.00% | 2093 | 28.15% |
| 0.688828406719846 | 4675 | 19.59% | 4675 | 28.45% | 0 | 0.00% |
| 1.2496256782109 | 576 | 2.41% | 0 | 0.00% | 576 | 7.75% |
| 1.37031561474091 | 1038 | 4.35% | 1038 | 6.32% | 0 | 0.00% |
| 1.9213819362064 | 406 | 1.70% | 0 | 0.00% | 406 | 5.46% |
| 2.05180282276197 | 581 | 2.43% | 581 | 3.54% | 0 | 0.00% |
| Missing |
266
(1.10%) |
– |
48
(0.29%) |
– |
27
(0.36%) |
– |
| Total | 24131 | 100% | 16479 | 100% | 7461 | 100% |
|
| -4.12442438575313 -4.08158204942758 -3.45266812775762 -3.40009484140652 -2.78091186976212 -2.71860763338546 -2.10915561176662 -2.0371204253644 -1.43739935377111 -1.35563321734334 -0.765643095775612 -0.674146009322276 -0.0938868377801087 0.00734119869878457 0.577869420215394 0.688828406719846 1.2496256782109 1.37031561474091 1.9213819362064 2.05180282276197 |
|
5117, 3208, 2470, 2289, 352
2028, 1426, 1160, 977, 216 |
 |
| -4.12442438575313 -4.08158204942758 -3.45266812775762 -3.40009484140652 -2.78091186976212 -2.71860763338546 -2.10915561176662 -2.0371204253644 -1.43739935377111 -1.35563321734334 -0.765643095775612 -0.674146009322276 -0.0938868377801087 0.00734119869878457 0.577869420215394 0.688828406719846 1.2496256782109 1.37031561474091 1.9213819362064 2.05180282276197 |
|
3527, 2038, 1597, 1473, 214
1490, 895, 729, 613, 130 |
These graphs reflect only undergraduates attending 4-year colleges who are of normative age -- 18, 19, 20, 21, or 22, +/- 1, for freshman, sophomores, juniors, seniors, and later undergraduates, respectively. Solid lines represent women. Dotted lines represent men.
Previous column:
physattr.normed
Next column:
educational.ambition
Previous alphabetically:
physattr.normed
Next alphabetically:
political.views