1830, 1290, 1045, 866, 203
By Column: Everything | Demographics | Sexual History | Attitudes | Relationships | Dating | Hookups
Alphabetically: Everything | Demographics | Sexual History | Attitudes | Relationships | Dating | Hookups
wants.children (in Attitudes)
| Variable Summary | Undergrad | Freshman | Sophomore | Junior | Senior |
| Sexually active students: | Undergrad | Freshman | Sophomore | Junior | Senior |
| Casual-sexually active students: | Undergrad | Freshman | Sophomore | Junior | Senior |
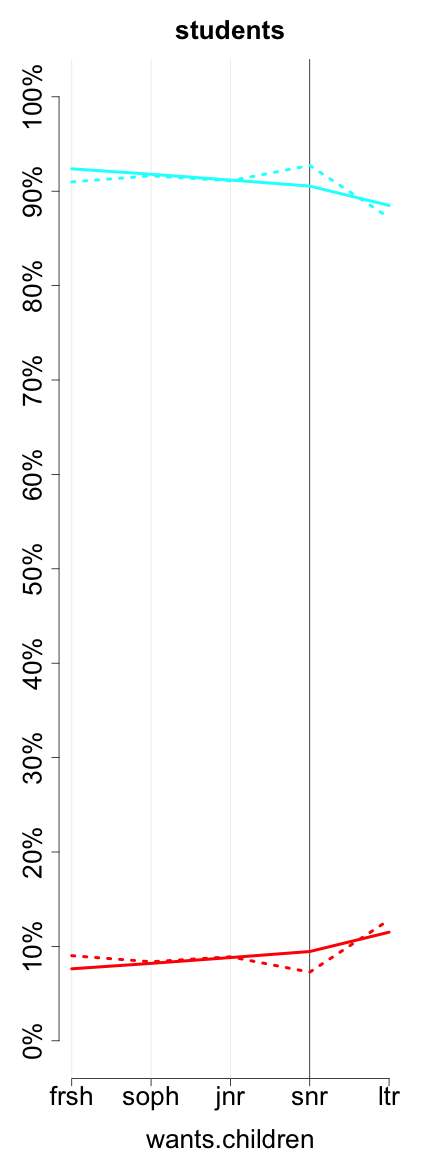
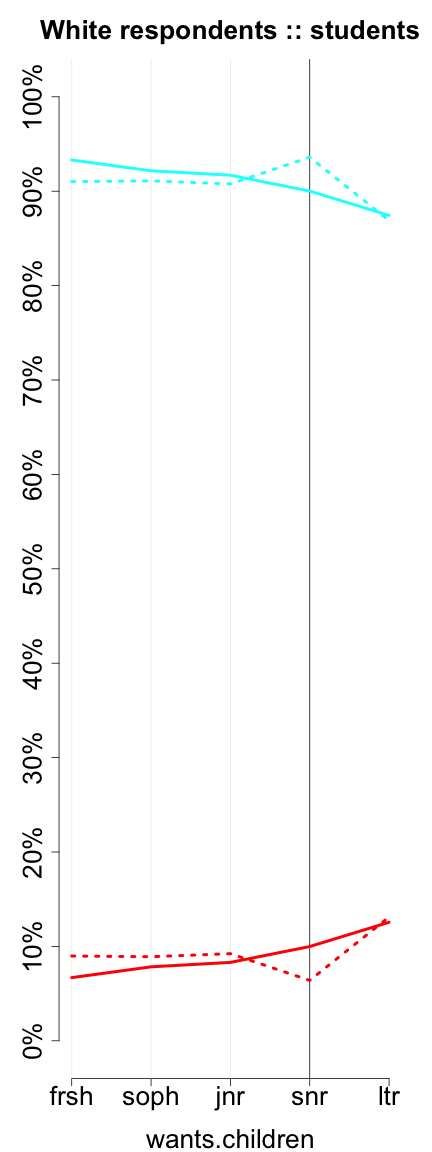
Do you want to have children (or more children in the future)?
| students (wants_children) | ||||||
| All Rs | Female | Male | ||||
| Mean (Std. Dev.) | 0.90 (0.30) | 0.90 (0.31) | 0.90 (0.30) | |||
| 0 | 2308 | 10.36% | 1606 | 10.43% | 684 | 10.09% |
| 1 | 19966 | 89.64% | 13797 | 89.57% | 6095 | 89.91% |
| Missing |
1857
(7.70%) |
– |
1076
(6.53%) |
– |
682
(9.14%) |
– |
| Total | 24131 | 100% | 16479 | 100% | 7461 | 100% |
|
| Negative (no/false) Positive (yes/true) |
|
4655, 2987, 2359, 2157, 339
1830, 1290, 1045, 866, 203 |
 |
| Negative (no/false) Positive (yes/true) |
|
3153, 1876, 1517, 1392, 207
1325, 786, 650, 547, 122 |
These graphs reflect only undergraduates attending 4-year colleges who are of normative age -- 18, 19, 20, 21, or 22, +/- 1, for freshman, sophomores, juniors, seniors, and later undergraduates, respectively. Solid lines represent women. Dotted lines represent men.
Previous column:
any.children
Next column:
ideal.age.for.childbearing
Previous alphabetically:
virgin
Next alphabetically:
weight.in.pounds