2037, 1430, 1160, 980, 216
By Column: Everything | Demographics | Sexual History | Attitudes | Relationships | Dating | Hookups
Alphabetically: Everything | Demographics | Sexual History | Attitudes | Relationships | Dating | Hookups
survey.imputed.year
| Variable Summary | Undergrad | Freshman | Sophomore | Junior | Senior |
| Sexually active students: | Undergrad | Freshman | Sophomore | Junior | Senior |
| Casual-sexually active students: | Undergrad | Freshman | Sophomore | Junior | Senior |
This variable, survey.imputed.year, is constructed using information from the variables, server.year, server.month, server.day, signature.year, signature.month, and signature.day.
This variable, survey.imputed.year, is used in the construction of the variable, survey.imputed.date.
| students (survey_imputed_year) | ||||||
| All Rs | Female | Male | ||||
| 2005 | 1548 | 6.42% | 1101 | 6.68% | 440 | 5.90% |
| 2006 | 3824 | 15.85% | 2486 | 15.09% | 1282 | 17.18% |
| 2007 | 5494 | 22.77% | 3532 | 21.43% | 1918 | 25.71% |
| 2008 | 5275 | 21.86% | 3743 | 22.71% | 1509 | 20.23% |
| 2009 | 4290 | 17.78% | 3063 | 18.59% | 1188 | 15.92% |
| 2010 | 1889 | 7.83% | 1324 | 8.03% | 557 | 7.47% |
| 2011 | 1808 | 7.49% | 1230 | 7.46% | 566 | 7.59% |
| Missing |
3
(0.01%) |
– |
0
(0.00%) |
– |
1
(0.01%) |
– |
| Total | 24131 | 100% | 16479 | 100% | 7461 | 100% |
|
| 2005 2006 2007 2008 2009 2010 2011 |
|
5137, 3215, 2474, 2295, 353
2037, 1430, 1160, 980, 216 |
 |
| 2005 2006 2007 2008 2009 2010 2011 |
|
3537, 2041, 1598, 1477, 215
1496, 895, 729, 615, 130 |
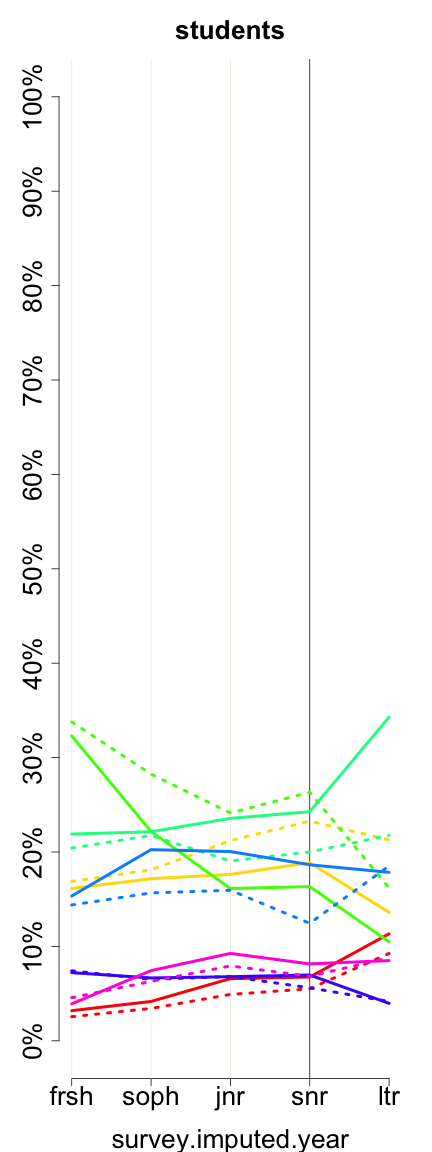
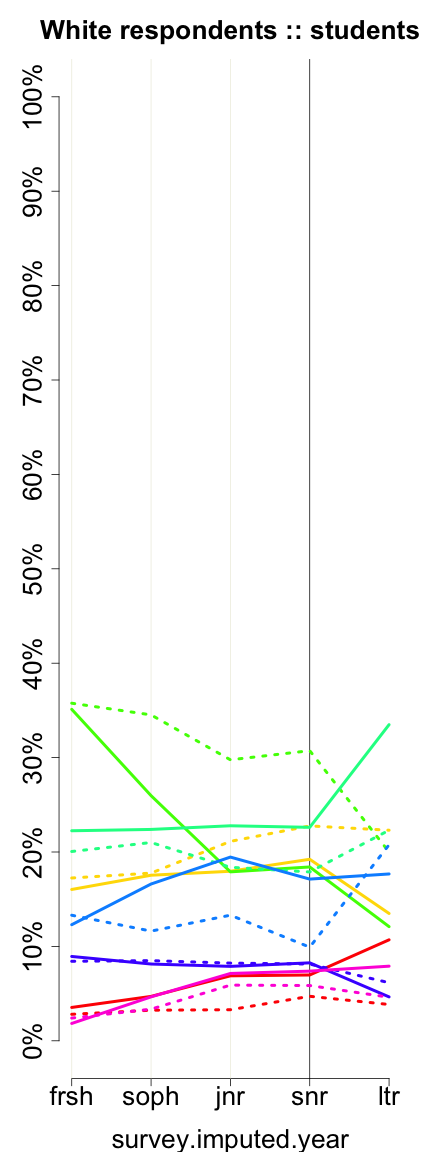
These graphs reflect only undergraduates attending 4-year colleges who are of normative age -- 18, 19, 20, 21, or 22, +/- 1, for freshman, sophomores, juniors, seniors, and later undergraduates, respectively. Solid lines represent women. Dotted lines represent men.
Previous column:
signature.day
Next column:
survey.imputed.month
Previous alphabetically:
survey.imputed.month
Next alphabetically:
talked.since.hookup