1976, 1376, 1125, 957, 215
By Column: Everything | Demographics | Sexual History | Attitudes | Relationships | Dating | Hookups
Alphabetically: Everything | Demographics | Sexual History | Attitudes | Relationships | Dating | Hookups
signature.day (in Demographics)
| Variable Summary | Undergrad | Freshman | Sophomore | Junior | Senior |
| Sexually active students: | Undergrad | Freshman | Sophomore | Junior | Senior |
| Casual-sexually active students: | Undergrad | Freshman | Sophomore | Junior | Senior |
Student signature
The same question also applies to the variables, signature.year, and signature.month.
This variable, signature.day, is used in the construction of the variables, survey.imputed.year, survey.imputed.month, and survey.imputed.day.
| students (signature_day) | ||||||
| All Rs | Female | Male | ||||
| Mean (Std. Dev.) | 14.00 (8.64) | 14.29 (8.67) | 13.44 (8.51) | |||
| 0 | 6 | 0.03% | 2 | 0.01% | 1 | 0.01% |
| 1 | 1334 | 5.65% | 882 | 5.46% | 395 | 5.43% |
| 2 | 1144 | 4.85% | 736 | 4.55% | 399 | 5.48% |
| 3 | 977 | 4.14% | 634 | 3.92% | 339 | 4.66% |
| 4 | 883 | 3.74% | 571 | 3.53% | 309 | 4.24% |
| 5 | 670 | 2.84% | 476 | 2.95% | 191 | 2.62% |
| 6 | 667 | 2.83% | 461 | 2.85% | 201 | 2.76% |
| 7 | 675 | 2.86% | 435 | 2.69% | 234 | 3.21% |
| 8 | 833 | 3.53% | 556 | 3.44% | 274 | 3.76% |
| 9 | 1398 | 5.92% | 956 | 5.92% | 439 | 6.03% |
| 10 | 1055 | 4.47% | 699 | 4.33% | 354 | 4.86% |
| 11 | 787 | 3.33% | 504 | 3.12% | 280 | 3.85% |
| 12 | 683 | 2.89% | 440 | 2.72% | 242 | 3.32% |
| 13 | 849 | 3.60% | 571 | 3.53% | 271 | 3.72% |
| 14 | 719 | 3.05% | 493 | 3.05% | 223 | 3.06% |
| 15 | 773 | 3.27% | 526 | 3.26% | 240 | 3.30% |
| 16 | 707 | 2.99% | 442 | 2.74% | 263 | 3.61% |
| 17 | 870 | 3.69% | 634 | 3.92% | 230 | 3.16% |
| 18 | 770 | 3.26% | 549 | 3.40% | 219 | 3.01% |
| 19 | 1100 | 4.66% | 776 | 4.80% | 316 | 4.34% |
| 20 | 703 | 2.98% | 491 | 3.04% | 209 | 2.87% |
| 21 | 612 | 2.59% | 438 | 2.71% | 170 | 2.34% |
| 22 | 593 | 2.51% | 445 | 2.75% | 145 | 1.99% |
| 23 | 555 | 2.35% | 389 | 2.41% | 162 | 2.23% |
| 24 | 458 | 1.94% | 330 | 2.04% | 127 | 1.74% |
| 25 | 656 | 2.78% | 487 | 3.01% | 167 | 2.29% |
| 26 | 669 | 2.83% | 475 | 2.94% | 188 | 2.58% |
| 27 | 642 | 2.72% | 457 | 2.83% | 183 | 2.51% |
| 28 | 550 | 2.33% | 409 | 2.53% | 139 | 1.91% |
| 29 | 454 | 1.92% | 315 | 1.95% | 136 | 1.87% |
| 30 | 665 | 2.82% | 466 | 2.88% | 196 | 2.69% |
| 31 | 152 | 0.64% | 114 | 0.71% | 38 | 0.52% |
| Missing |
522
(2.16%) |
– |
320
(1.94%) |
– |
181
(2.43%) |
– |
| Total | 24131 | 100% | 16479 | 100% | 7461 | 100% |
|
| 0 1 2 3 4 5 6 7 8 9 10 11 12 13 14 15 16 17 18 19 20 21 22 23 24 25 26 27 28 29 30 31 |
|
5036, 3109, 2426, 2242, 351
1976, 1376, 1125, 957, 215 |
 |
| 0 1 2 3 4 5 6 7 8 9 10 11 12 13 14 15 16 17 18 19 20 21 22 23 24 25 26 27 28 29 30 31 |
|
3475, 1978, 1566, 1449, 214
1452, 868, 707, 600, 129 |
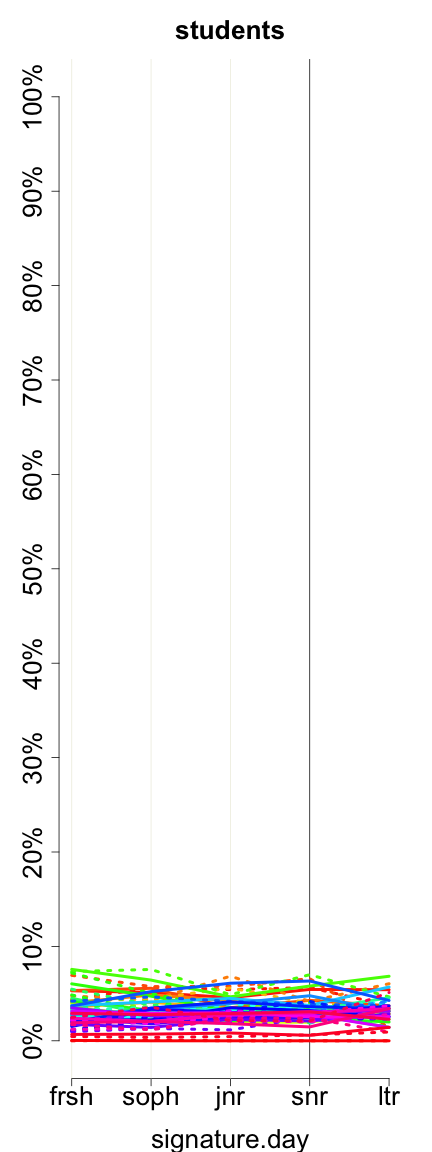
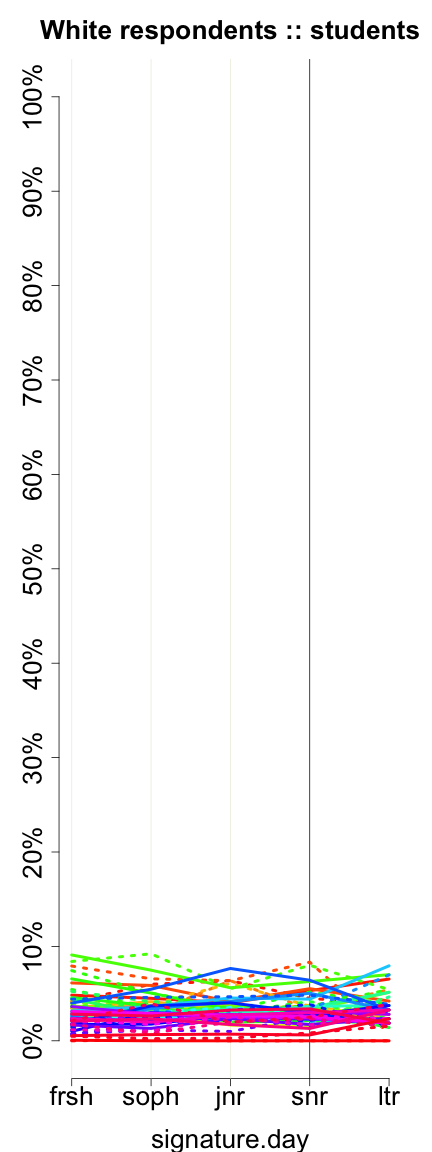
These graphs reflect only undergraduates attending 4-year colleges who are of normative age -- 18, 19, 20, 21, or 22, +/- 1, for freshman, sophomores, juniors, seniors, and later undergraduates, respectively. Solid lines represent women. Dotted lines represent men.
Previous column:
signature.month
Next column:
survey.imputed.year
Previous alphabetically:
shrooms
Next alphabetically:
signature.month