2037, 1430, 1160, 980, 216
By Column: Everything | Demographics | Sexual History | Attitudes | Relationships | Dating | Hookups
Alphabetically: Everything | Demographics | Sexual History | Attitudes | Relationships | Dating | Hookups
survey.imputed.day
| Variable Summary | Undergrad | Freshman | Sophomore | Junior | Senior |
| Sexually active students: | Undergrad | Freshman | Sophomore | Junior | Senior |
| Casual-sexually active students: | Undergrad | Freshman | Sophomore | Junior | Senior |
This variable, survey.imputed.day, is constructed using information from the variables, server.year, server.month, server.day, signature.year, signature.month, and signature.day.
This variable, survey.imputed.day, is used in the construction of the variable, survey.imputed.date.
| students (survey_imputed_day) | ||||||
| All Rs | Female | Male | ||||
| 0 | 2 | 0.01% | 0 | 0.00% | 0 | 0.00% |
| 01 | 643 | 2.66% | 438 | 2.66% | 202 | 2.71% |
| 02 | 1094 | 4.53% | 709 | 4.30% | 377 | 5.05% |
| 03 | 640 | 2.65% | 407 | 2.47% | 231 | 3.10% |
| 04 | 659 | 2.73% | 423 | 2.57% | 232 | 3.11% |
| 05 | 638 | 2.64% | 432 | 2.62% | 202 | 2.71% |
| 06 | 575 | 2.38% | 396 | 2.40% | 174 | 2.33% |
| 07 | 598 | 2.48% | 390 | 2.37% | 201 | 2.69% |
| 08 | 735 | 3.05% | 484 | 2.94% | 249 | 3.34% |
| 09 | 1302 | 5.40% | 884 | 5.36% | 410 | 5.50% |
| 1 | 233 | 0.97% | 165 | 1.00% | 65 | 0.87% |
| 10 | 1064 | 4.41% | 709 | 4.30% | 351 | 4.71% |
| 11 | 806 | 3.34% | 515 | 3.13% | 284 | 3.81% |
| 12 | 751 | 3.11% | 484 | 2.94% | 264 | 3.54% |
| 13 | 893 | 3.70% | 591 | 3.59% | 289 | 3.87% |
| 14 | 750 | 3.11% | 520 | 3.16% | 225 | 3.02% |
| 15 | 795 | 3.29% | 546 | 3.31% | 240 | 3.22% |
| 16 | 729 | 3.02% | 475 | 2.88% | 246 | 3.30% |
| 17 | 908 | 3.76% | 645 | 3.91% | 253 | 3.39% |
| 18 | 791 | 3.28% | 566 | 3.43% | 221 | 2.96% |
| 19 | 1179 | 4.89% | 820 | 4.98% | 349 | 4.68% |
| 2 | 91 | 0.38% | 58 | 0.35% | 32 | 0.43% |
| 20 | 743 | 3.08% | 509 | 3.09% | 226 | 3.03% |
| 21 | 647 | 2.68% | 461 | 2.80% | 177 | 2.37% |
| 22 | 613 | 2.54% | 450 | 2.73% | 157 | 2.10% |
| 23 | 567 | 2.35% | 393 | 2.38% | 168 | 2.25% |
| 24 | 460 | 1.91% | 333 | 2.02% | 124 | 1.66% |
| 25 | 660 | 2.74% | 486 | 2.95% | 172 | 2.31% |
| 26 | 677 | 2.81% | 483 | 2.93% | 183 | 2.45% |
| 27 | 673 | 2.79% | 479 | 2.91% | 192 | 2.57% |
| 28 | 556 | 2.30% | 407 | 2.47% | 144 | 1.93% |
| 29 | 473 | 1.96% | 327 | 1.98% | 142 | 1.90% |
| 3 | 360 | 1.49% | 242 | 1.47% | 116 | 1.55% |
| 30 | 702 | 2.91% | 497 | 3.02% | 201 | 2.69% |
| 31 | 136 | 0.56% | 104 | 0.63% | 32 | 0.43% |
| 4 | 238 | 0.99% | 154 | 0.93% | 84 | 1.13% |
| 5 | 167 | 0.69% | 119 | 0.72% | 47 | 0.63% |
| 6 | 121 | 0.50% | 84 | 0.51% | 35 | 0.47% |
| 7 | 128 | 0.53% | 71 | 0.43% | 55 | 0.74% |
| 8 | 168 | 0.70% | 113 | 0.69% | 53 | 0.71% |
| 9 | 165 | 0.68% | 110 | 0.67% | 55 | 0.74% |
| Missing |
1
(0.00%) |
– |
0
(0.00%) |
– |
1
(0.01%) |
– |
| Total | 24131 | 100% | 16479 | 100% | 7461 | 100% |
|
| 0 01 02 03 04 05 06 07 08 09 1 10 11 12 13 14 15 16 17 18 19 2 20 21 22 23 24 25 26 27 28 29 3 30 31 4 5 6 7 8 9 |
|
5137, 3215, 2474, 2295, 353
2037, 1430, 1160, 980, 216 |
 |
| 0 01 02 03 04 05 06 07 08 09 1 10 11 12 13 14 15 16 17 18 19 2 20 21 22 23 24 25 26 27 28 29 3 30 31 4 5 6 7 8 9 |
|
3537, 2041, 1598, 1477, 215
1496, 895, 729, 615, 130 |
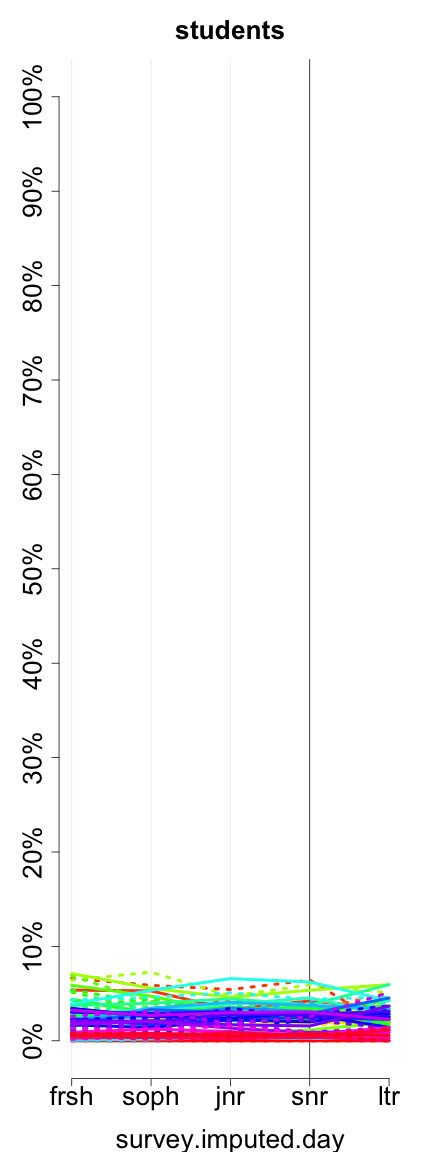
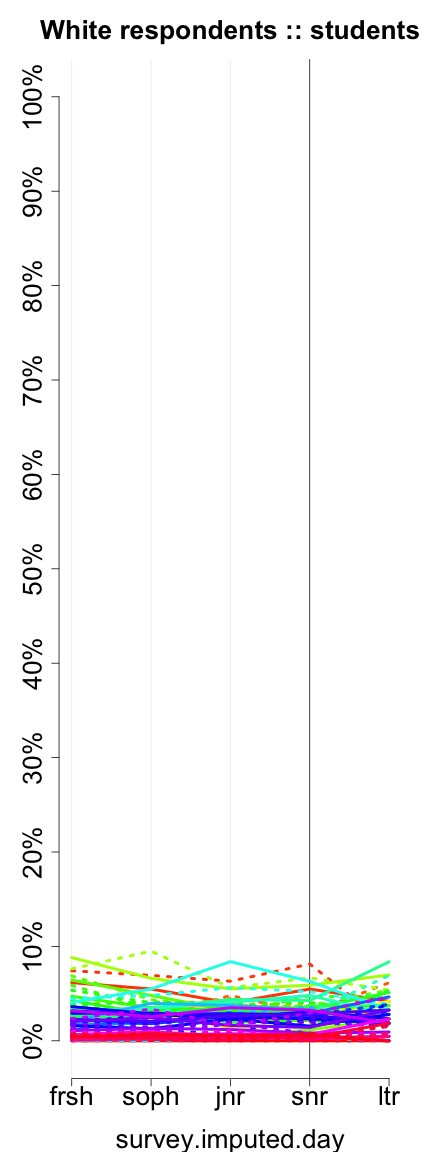
These graphs reflect only undergraduates attending 4-year colleges who are of normative age -- 18, 19, 20, 21, or 22, +/- 1, for freshman, sophomores, juniors, seniors, and later undergraduates, respectively. Solid lines represent women. Dotted lines represent men.
Previous column:
survey.imputed.month
Next column:
survey.imputed.date
Previous alphabetically:
survey.imputed.date
Next alphabetically:
survey.imputed.month