
1723, 1252, 969, 835, 173
By Column: Everything | Demographics | Sexual History | Attitudes | Relationships | Dating | Hookups
Alphabetically: Everything | Demographics | Sexual History | Attitudes | Relationships | Dating | Hookups
server.month
| Variable Summary | Undergrad | Freshman | Sophomore | Junior | Senior |
| Sexually active students: | Undergrad | Freshman | Sophomore | Junior | Senior |
| Casual-sexually active students: | Undergrad | Freshman | Sophomore | Junior | Senior |
This variable, server.month, is constructed using information from the variable, server.date.
This variable, server.month, is used in the construction of the variables, survey.imputed.year, survey.imputed.month, and survey.imputed.day.
| students (server_month) | ||||||
| All Rs | Female | Male | ||||
| 01 | 1603 | 8.05% | 1111 | 8.16% | 474 | 7.72% |
| 02 | 1910 | 9.59% | 1337 | 9.82% | 551 | 8.97% |
| 03 | 2200 | 11.04% | 1572 | 11.55% | 618 | 10.06% |
| 04 | 5336 | 26.78% | 3617 | 26.57% | 1695 | 27.59% |
| 05 | 1802 | 9.04% | 1261 | 9.26% | 529 | 8.61% |
| 06 | 293 | 1.47% | 196 | 1.44% | 90 | 1.47% |
| 07 | 166 | 0.83% | 110 | 0.81% | 51 | 0.83% |
| 08 | 152 | 0.76% | 116 | 0.85% | 34 | 0.55% |
| 09 | 1612 | 8.09% | 1167 | 8.57% | 434 | 7.06% |
| 10 | 3597 | 18.05% | 2338 | 17.17% | 1230 | 20.02% |
| 11 | 809 | 4.06% | 501 | 3.68% | 290 | 4.72% |
| 12 | 443 | 2.22% | 288 | 2.12% | 147 | 2.39% |
| Missing |
4208
(17.44%) |
– |
2865
(17.39%) |
– |
1318
(17.67%) |
– |
| Total | 24131 | 100% | 16479 | 100% | 7461 | 100% |
|
| 01 02 03 04 05 06 07 08 09 10 11 12 |
|
4473, 2739, 2024, 1916, 279
1723, 1252, 969, 835, 173 |
 |
| 01 02 03 04 05 06 07 08 09 10 11 12 |
|
3170, 1775, 1337, 1242, 171
1309, 811, 629, 531, 116 |
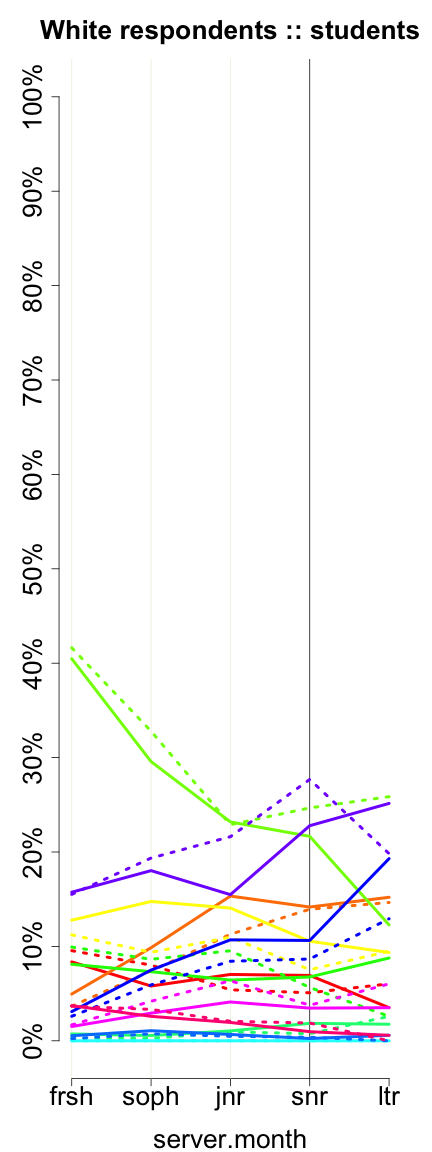
These graphs reflect only undergraduates attending 4-year colleges who are of normative age -- 18, 19, 20, 21, or 22, +/- 1, for freshman, sophomores, juniors, seniors, and later undergraduates, respectively. Solid lines represent women. Dotted lines represent men.
Previous column:
server.year
Next column:
server.day
Previous alphabetically:
server.day
Next alphabetically:
server.year