1196, 928, 799, 715, 169
930, 911, 837, 775, 179
491, 539, 606, 576, 143
By Column: Everything | Demographics | Sexual History | Attitudes | Relationships | Dating | Hookups
Alphabetically: Everything | Demographics | Sexual History | Attitudes | Relationships | Dating | Hookups
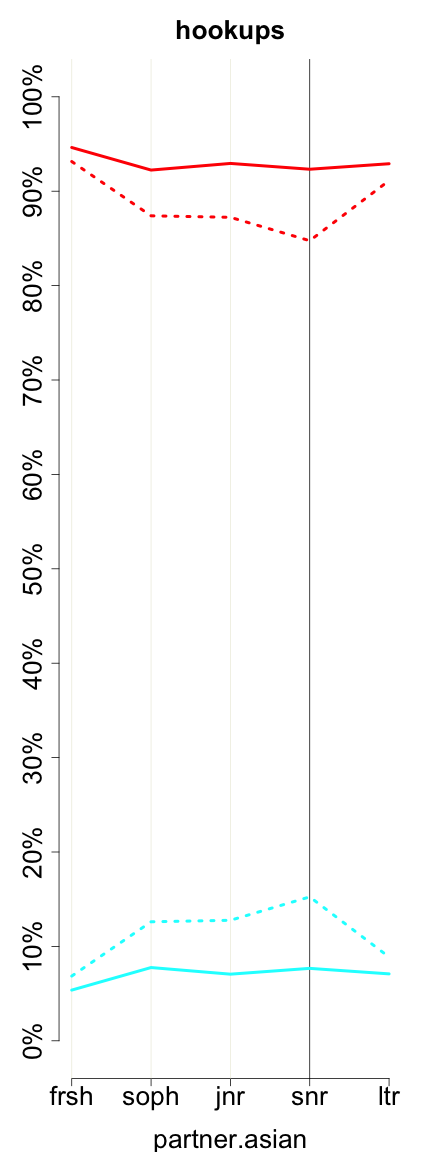
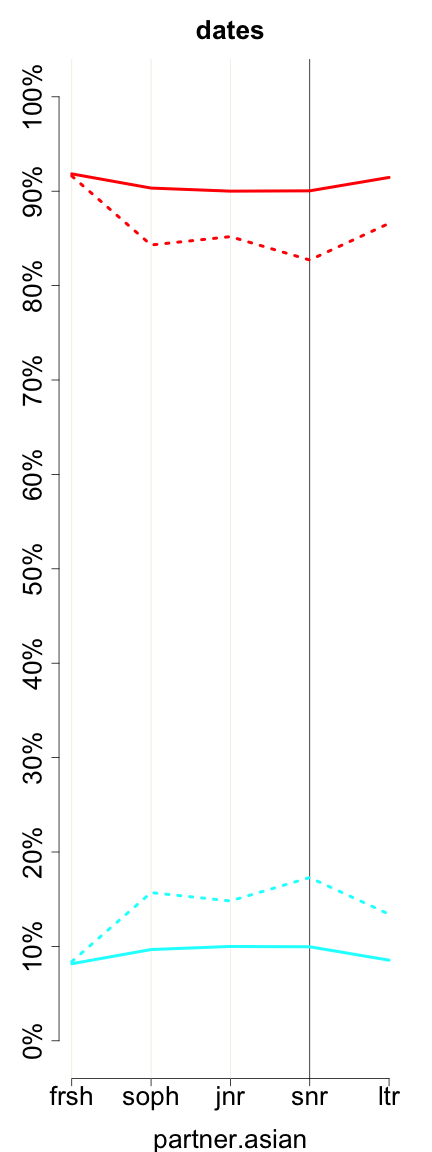
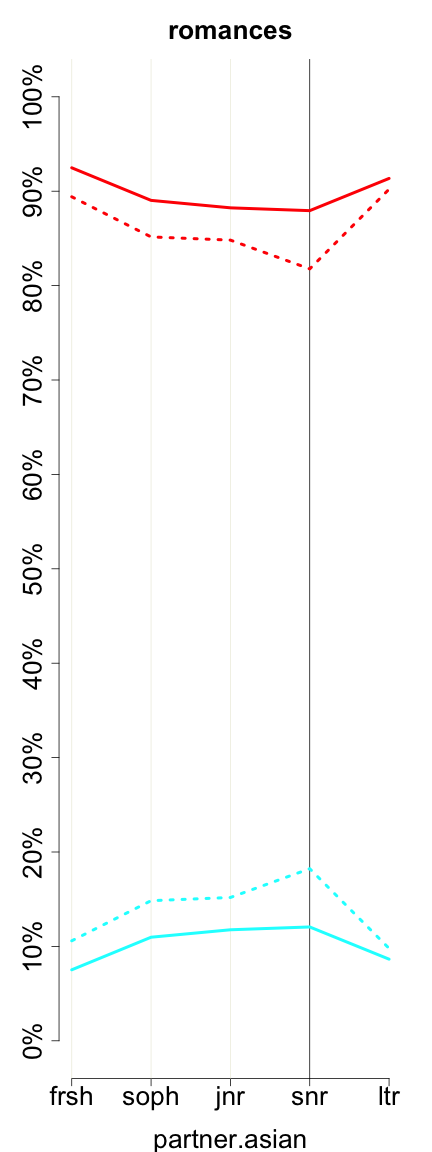
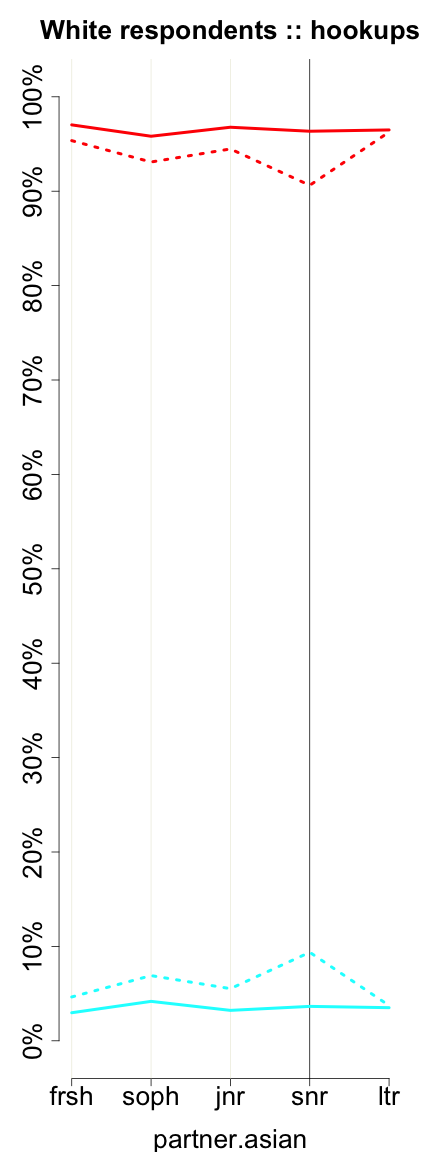
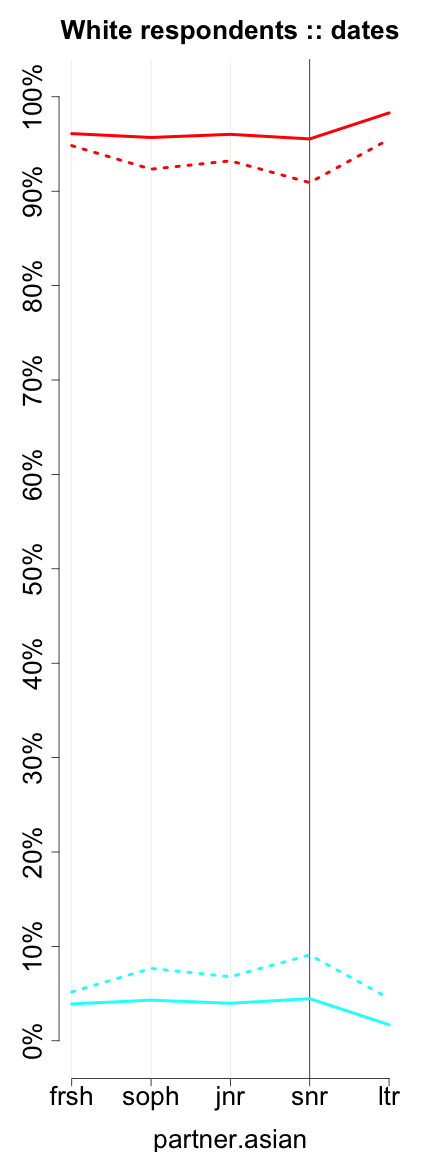
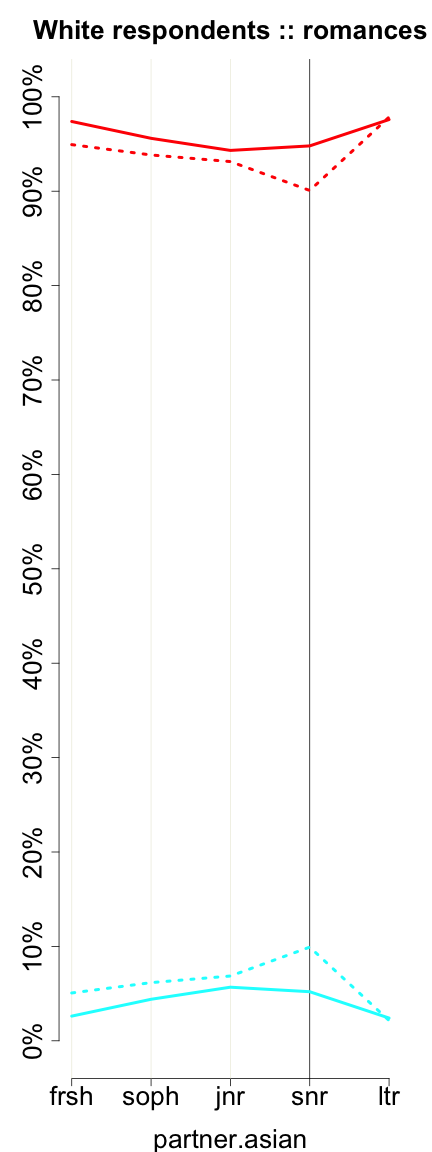
partner.asian (in Dating, Hookups and Relationships)
| Variable Summary | Undergrad | Freshman | Sophomore | Junior | Senior |
| Sexually active students: | Undergrad | Freshman | Sophomore | Junior | Senior |
| Casual-sexually active students: | Undergrad | Freshman | Sophomore | Junior | Senior |
Which of these racial or ethnic groups describes your partner? (check all that apply) -- Note that other.race, asian, and hispanic are collapsed versions of the preceding more detailed categories.
See also: partner.white, partner.black, partner.chinese, partner.japanese, partner.korean, partner.filipino, partner.vietnamese, partner.south.asian, partner.other.asian, partner.mexican, partner.puerto.rican, partner.other.hispanic, partner.native.american, partner.other.race.but.not.native.american, partner.race.specify, partner.other.race, and partner.hispanic.
This variable, partner.asian, is constructed using information from the variables, partner.chinese, partner.japanese, partner.korean, partner.filipino, partner.vietnamese, partner.south.asian, and partner.other.asian.
| hookups (partner_asian or hookup__partner_asian) | ||||||
| All Rs | Female | Male | ||||
| Mean (Std. Dev.) | 0.10 (0.29) | 0.08 (0.27) | 0.13 (0.34) | |||
| 0 | 13329 | 90.37% | 9126 | 92.01% | 4153 | 87.05% |
| 1 | 1420 | 9.63% | 793 | 7.99% | 618 | 12.95% |
| Missing |
0
(0.00%) |
– |
0
(0.00%) |
– |
0
(0.00%) |
– |
| Total | 14749 | 100% | 9919 | 100% | 4771 | 100% |
| dates (partner_asian or date__partner_asian) | ||||||
| All Rs | Female | Male | ||||
| Mean (Std. Dev.) | 0.13 (0.33) | 0.11 (0.32) | 0.16 (0.37) | |||
| 0 | 12624 | 87.13% | 8624 | 88.67% | 3959 | 84.11% |
| 1 | 1865 | 12.87% | 1102 | 11.33% | 748 | 15.89% |
| Missing |
0
(0.00%) |
– |
0
(0.00%) |
– |
0
(0.00%) |
– |
| Total | 14489 | 100% | 9726 | 100% | 4707 | 100% |
| romances (partner_asian or romance__partner_asian) | ||||||
| All Rs | Female | Male | ||||
| Mean (Std. Dev.) | 0.14 (0.34) | 0.13 (0.33) | 0.17 (0.37) | |||
| 0 | 10596 | 86.20% | 7850 | 87.37% | 2712 | 83.19% |
| 1 | 1696 | 13.80% | 1135 | 12.63% | 548 | 16.81% |
| Missing |
0
(0.00%) |
– |
0
(0.00%) |
– |
0
(0.00%) |
– |
| Total | 12292 | 100% | 8985 | 100% | 3260 | 100% |
|
|
|
| Negative (no/false) Positive (yes/true) | ||
|
2737, 1997, 1686, 1655, 268
1196, 928, 799, 715, 169 |
2205, 1986, 1741, 1737, 281
930, 911, 837, 775, 179 |
1782, 1604, 1624, 1650, 266
491, 539, 606, 576, 143 |
 |
 |
 |
| Negative (no/false) Positive (yes/true) | ||
|
2086, 1412, 1179, 1124, 171
926, 637, 543, 480, 107 |
1564, 1346, 1157, 1143, 176
715, 600, 545, 495, 111 |
1224, 1023, 1074, 1077, 166
375, 357, 408, 383, 93 |
These graphs reflect only undergraduates attending 4-year colleges who are of normative age -- 18, 19, 20, 21, or 22, +/- 1, for freshman, sophomores, juniors, seniors, and later undergraduates, respectively. Solid lines represent women. Dotted lines represent men.
Previous column:
partner.other.asian
Next column:
partner.native.american
Previous alphabetically:
other.race.but.not.native.american
Next alphabetically:
partner.attends.same.college