1196, 928, 799, 715, 169
930, 911, 837, 775, 179
491, 539, 606, 576, 143
By Column: Everything | Demographics | Sexual History | Attitudes | Relationships | Dating | Hookups
Alphabetically: Everything | Demographics | Sexual History | Attitudes | Relationships | Dating | Hookups
partner.other.asian (in Dating, Hookups and Relationships)
| Variable Summary | Undergrad | Freshman | Sophomore | Junior | Senior |
| Sexually active students: | Undergrad | Freshman | Sophomore | Junior | Senior |
| Casual-sexually active students: | Undergrad | Freshman | Sophomore | Junior | Senior |
Which of these racial or ethnic groups describes your partner? (check all that apply) -- Note that other.race, asian, and hispanic are collapsed versions of the preceding more detailed categories.
The same question also applies to the variables, partner.white, partner.black, partner.chinese, partner.japanese, partner.korean, partner.filipino, partner.vietnamese, partner.south.asian, partner.mexican, partner.puerto.rican, partner.other.hispanic, partner.native.american, partner.other.race.but.not.native.american, partner.race.specify, partner.other.race, partner.asian, and partner.hispanic.
This variable, partner.other.asian, is used in the construction of the variable, partner.asian.
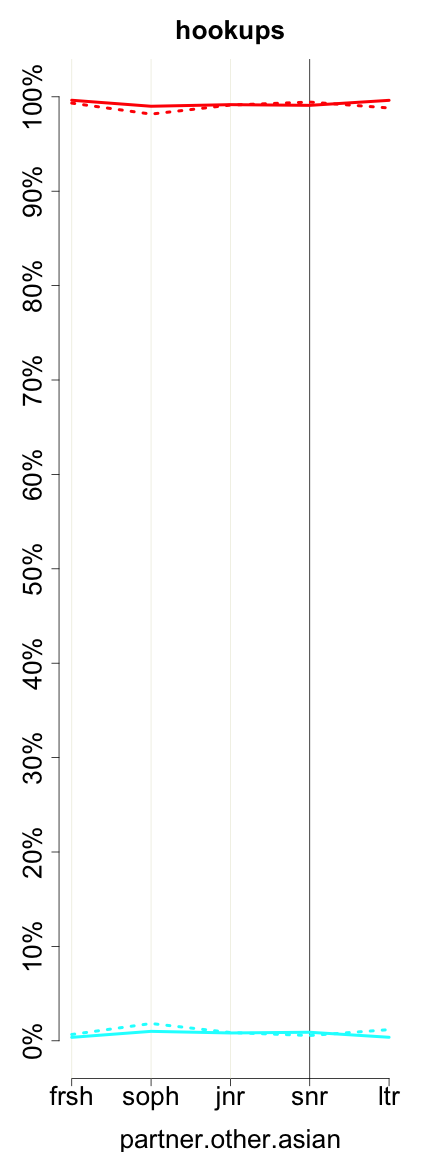
| hookups (partner_other_asian or hookup__partner_other_asian) | ||||||
| All Rs | Female | Male | ||||
| Mean (Std. Dev.) | 0.01 (0.10) | 0.01 (0.09) | 0.01 (0.11) | |||
| 0 | 14613 | 99.08% | 9842 | 99.22% | 4712 | 98.76% |
| 1 | 136 | 0.92% | 77 | 0.78% | 59 | 1.24% |
| Missing |
0
(0.00%) |
– |
0
(0.00%) |
– |
0
(0.00%) |
– |
| Total | 14749 | 100% | 9919 | 100% | 4771 | 100% |
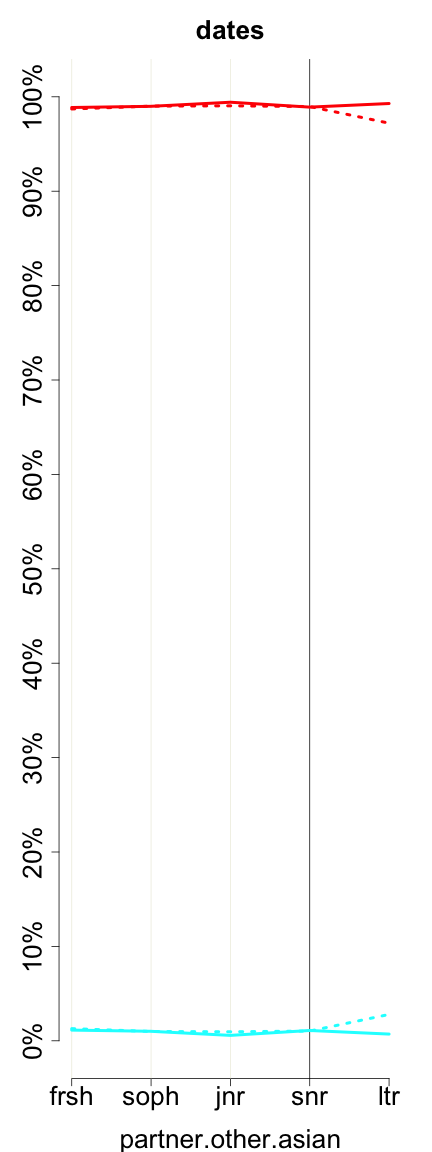
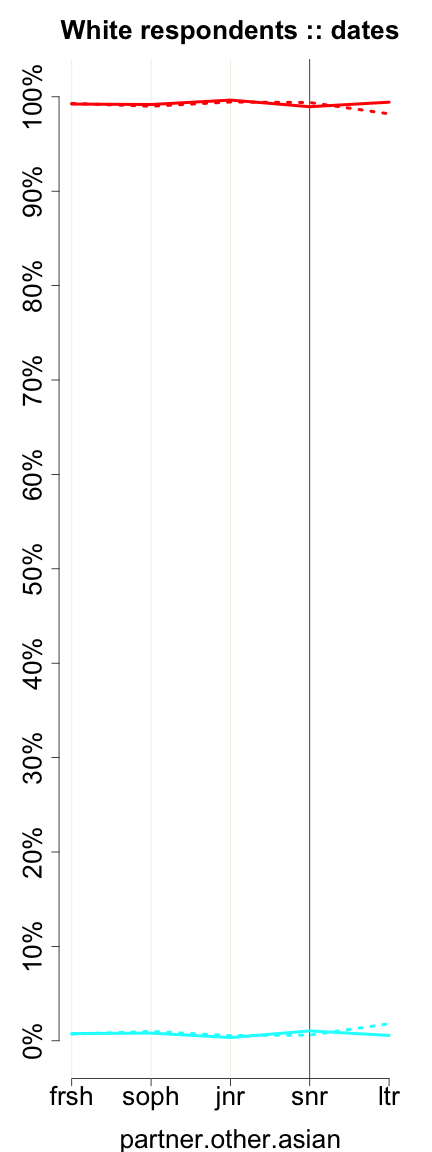
| dates (partner_other_asian or date__partner_other_asian) | ||||||
| All Rs | Female | Male | ||||
| Mean (Std. Dev.) | 0.01 (0.11) | 0.01 (0.10) | 0.01 (0.12) | |||
| 0 | 14323 | 98.85% | 9626 | 98.97% | 4643 | 98.64% |
| 1 | 166 | 1.15% | 100 | 1.03% | 64 | 1.36% |
| Missing |
0
(0.00%) |
– |
0
(0.00%) |
– |
0
(0.00%) |
– |
| Total | 14489 | 100% | 9726 | 100% | 4707 | 100% |
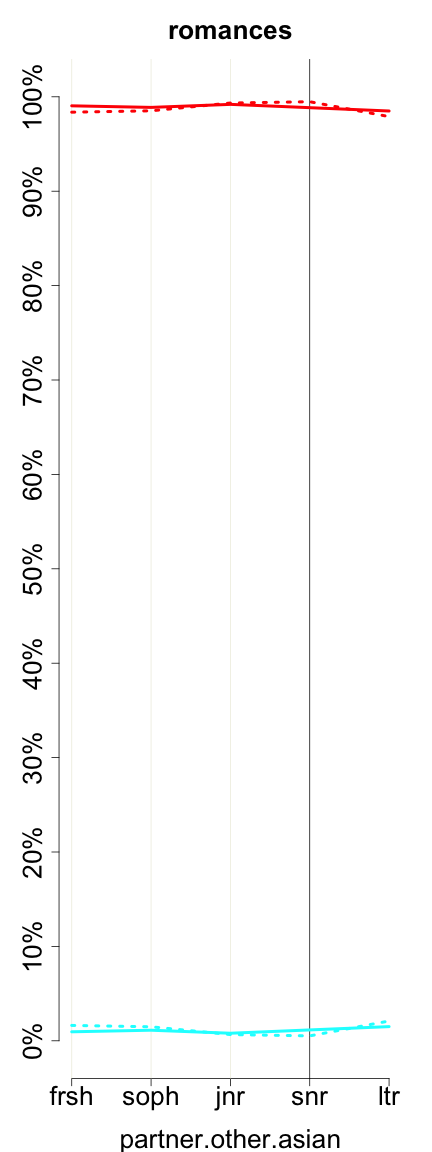
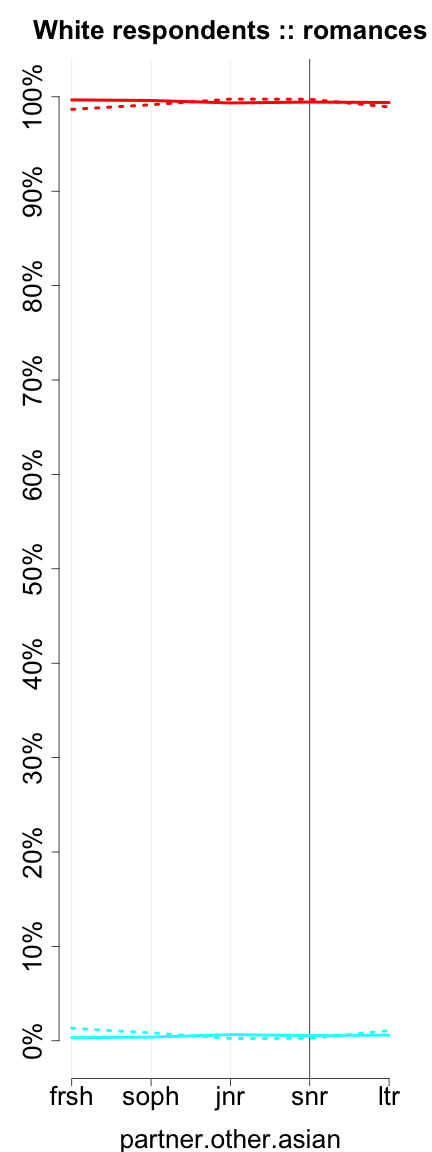
| romances (partner_other_asian or romance__partner_other_asian) | ||||||
| All Rs | Female | Male | ||||
| Mean (Std. Dev.) | 0.01 (0.11) | 0.01 (0.11) | 0.01 (0.11) | |||
| 0 | 12147 | 98.82% | 8879 | 98.82% | 3221 | 98.80% |
| 1 | 145 | 1.18% | 106 | 1.18% | 39 | 1.20% |
| Missing |
0
(0.00%) |
– |
0
(0.00%) |
– |
0
(0.00%) |
– |
| Total | 12292 | 100% | 8985 | 100% | 3260 | 100% |
|
|
|
| Negative (no/false) Positive (yes/true) | ||
|
2737, 1997, 1686, 1655, 268
1196, 928, 799, 715, 169 |
2205, 1986, 1741, 1737, 281
930, 911, 837, 775, 179 |
1782, 1604, 1624, 1650, 266
491, 539, 606, 576, 143 |
 |
 |
 |
| Negative (no/false) Positive (yes/true) | ||
|
2086, 1412, 1179, 1124, 171
926, 637, 543, 480, 107 |
1564, 1346, 1157, 1143, 176
715, 600, 545, 495, 111 |
1224, 1023, 1074, 1077, 166
375, 357, 408, 383, 93 |
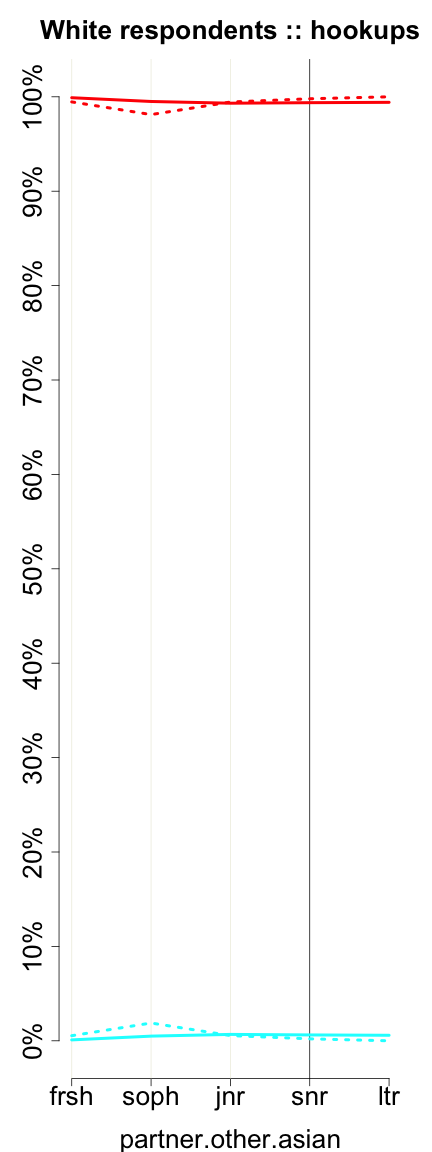
These graphs reflect only undergraduates attending 4-year colleges who are of normative age -- 18, 19, 20, 21, or 22, +/- 1, for freshman, sophomores, juniors, seniors, and later undergraduates, respectively. Solid lines represent women. Dotted lines represent men.
Previous column:
partner.south.asian
Next column:
partner.asian
Previous alphabetically:
partner.native.american
Next alphabetically:
partner.other.hispanic