1196, 928, 799, 713, 169
915, 899, 832, 773, 179
By Column: Everything | Demographics | Sexual History | Attitudes | Relationships | Dating | Hookups
Alphabetically: Everything | Demographics | Sexual History | Attitudes | Relationships | Dating | Hookups
year
| Variable Summary | Undergrad | Freshman | Sophomore | Junior | Senior |
| Sexually active students: | Undergrad | Freshman | Sophomore | Junior | Senior |
| Casual-sexually active students: | Undergrad | Freshman | Sophomore | Junior | Senior |
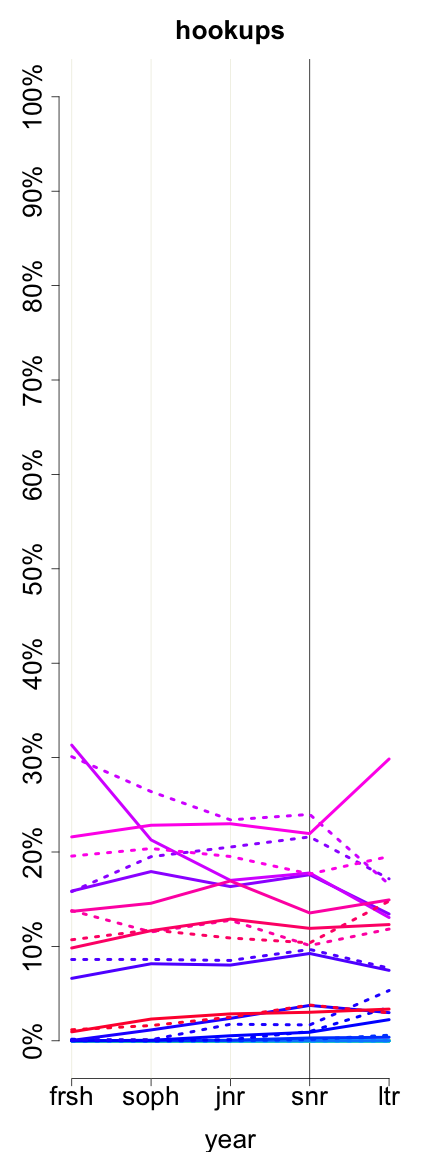
| hookups (year or hookup__year) | ||||||
| All Rs | Female | Male | ||||
| Mean (Std. Dev.) | 2007.54 (1.85) | 2007.55 (1.88) | 2007.51 (1.80) | |||
| 1981 | 1 | 0.01% | 1 | 0.01% | 0 | 0.00% |
| 1984 | 1 | 0.01% | 1 | 0.01% | 0 | 0.00% |
| 1985 | 2 | 0.01% | 1 | 0.01% | 1 | 0.02% |
| 1986 | 1 | 0.01% | 1 | 0.01% | 0 | 0.00% |
| 1987 | 1 | 0.01% | 1 | 0.01% | 0 | 0.00% |
| 1988 | 1 | 0.01% | 1 | 0.01% | 0 | 0.00% |
| 1990 | 3 | 0.02% | 1 | 0.01% | 2 | 0.04% |
| 1991 | 2 | 0.01% | 2 | 0.02% | 0 | 0.00% |
| 1992 | 3 | 0.02% | 2 | 0.02% | 1 | 0.02% |
| 1993 | 4 | 0.03% | 4 | 0.04% | 0 | 0.00% |
| 1995 | 3 | 0.02% | 2 | 0.02% | 1 | 0.02% |
| 1997 | 6 | 0.04% | 5 | 0.05% | 1 | 0.02% |
| 1998 | 10 | 0.07% | 5 | 0.05% | 5 | 0.10% |
| 1999 | 8 | 0.05% | 5 | 0.05% | 3 | 0.06% |
| 2000 | 8 | 0.05% | 7 | 0.07% | 1 | 0.02% |
| 2001 | 17 | 0.12% | 12 | 0.12% | 5 | 0.10% |
| 2002 | 34 | 0.23% | 23 | 0.23% | 11 | 0.23% |
| 2003 | 85 | 0.58% | 61 | 0.62% | 24 | 0.50% |
| 2004 | 221 | 1.50% | 172 | 1.74% | 49 | 1.03% |
| 2005 | 1140 | 7.74% | 743 | 7.50% | 393 | 8.24% |
| 2006 | 2374 | 16.11% | 1549 | 15.63% | 819 | 17.17% |
| 2007 | 3266 | 22.16% | 2102 | 21.20% | 1150 | 24.11% |
| 2008 | 3121 | 21.18% | 2184 | 22.03% | 928 | 19.46% |
| 2009 | 2195 | 14.90% | 1541 | 15.55% | 643 | 13.48% |
| 2010 | 1901 | 12.90% | 1277 | 12.88% | 616 | 12.92% |
| 2011 | 328 | 2.23% | 210 | 2.12% | 116 | 2.43% |
| Missing |
13
(0.09%) |
– |
6
(0.06%) |
– |
2
(0.04%) |
– |
| Total | 14749 | 100% | 9919 | 100% | 4771 | 100% |
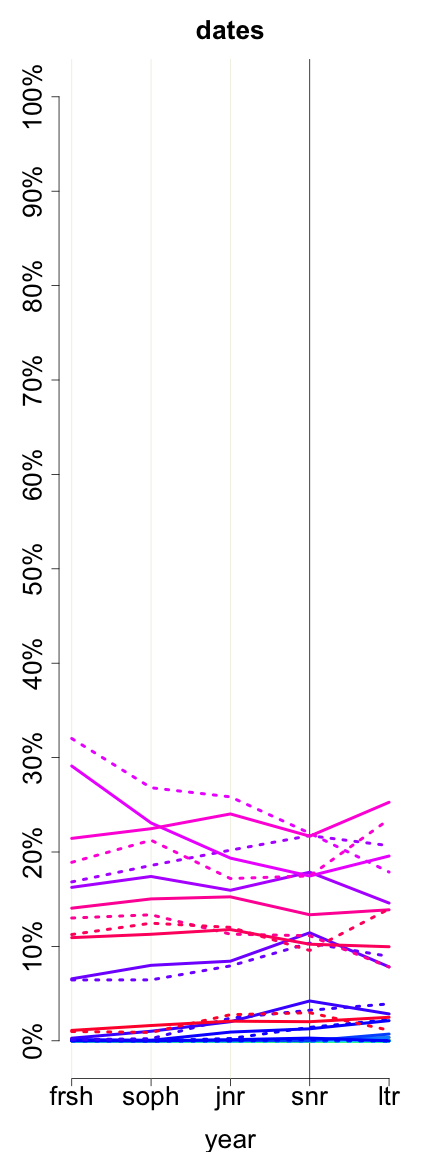
| dates (year or date__year) | ||||||
| All Rs | Female | Male | ||||
| Mean (Std. Dev.) | 2007.49 (1.95) | 2007.49 (1.97) | 2007.49 (1.91) | |||
| 1980 | 2 | 0.01% | 0 | 0.00% | 2 | 0.04% |
| 1981 | 3 | 0.02% | 3 | 0.03% | 0 | 0.00% |
| 1982 | 1 | 0.01% | 1 | 0.01% | 0 | 0.00% |
| 1985 | 2 | 0.01% | 2 | 0.02% | 0 | 0.00% |
| 1987 | 1 | 0.01% | 1 | 0.01% | 0 | 0.00% |
| 1989 | 2 | 0.01% | 1 | 0.01% | 1 | 0.02% |
| 1990 | 3 | 0.02% | 1 | 0.01% | 2 | 0.04% |
| 1991 | 2 | 0.01% | 2 | 0.02% | 0 | 0.00% |
| 1992 | 4 | 0.03% | 2 | 0.02% | 2 | 0.04% |
| 1993 | 4 | 0.03% | 4 | 0.04% | 0 | 0.00% |
| 1994 | 2 | 0.01% | 2 | 0.02% | 0 | 0.00% |
| 1995 | 3 | 0.02% | 2 | 0.02% | 1 | 0.02% |
| 1996 | 4 | 0.03% | 4 | 0.04% | 0 | 0.00% |
| 1997 | 6 | 0.04% | 5 | 0.05% | 1 | 0.02% |
| 1998 | 10 | 0.07% | 7 | 0.07% | 3 | 0.06% |
| 1999 | 7 | 0.05% | 3 | 0.03% | 4 | 0.09% |
| 2000 | 21 | 0.15% | 16 | 0.17% | 5 | 0.11% |
| 2001 | 20 | 0.14% | 13 | 0.13% | 7 | 0.15% |
| 2002 | 32 | 0.22% | 25 | 0.26% | 7 | 0.15% |
| 2003 | 108 | 0.75% | 80 | 0.83% | 26 | 0.56% |
| 2004 | 251 | 1.74% | 177 | 1.83% | 72 | 1.54% |
| 2005 | 1124 | 7.81% | 759 | 7.85% | 360 | 7.71% |
| 2006 | 2334 | 16.21% | 1515 | 15.67% | 808 | 17.29% |
| 2007 | 3142 | 21.82% | 2022 | 20.91% | 1112 | 23.80% |
| 2008 | 3032 | 21.06% | 2142 | 22.15% | 884 | 18.92% |
| 2009 | 2158 | 14.99% | 1503 | 15.54% | 645 | 13.81% |
| 2010 | 1855 | 12.88% | 1212 | 12.53% | 634 | 13.57% |
| 2011 | 266 | 1.85% | 167 | 1.73% | 96 | 2.05% |
| Missing |
90
(0.62%) |
– |
55
(0.57%) |
– |
35
(0.74%) |
– |
| Total | 14489 | 100% | 9726 | 100% | 4707 | 100% |
|
|
| hookups: 1981 1984 1985 1986 1987 1988 1990 1991 1992 1993 1995 1997 1998 1999 2000 2001 2002 2003 2004 2005 2006 2007 2008 2009 2010 2011 | |
| dates: 1980 1981 1982 1985 1987 1989 1990 1991 1992 1993 1994 1995 1996 1997 1998 1999 2000 2001 2002 2003 2004 2005 2006 2007 2008 2009 2010 2011 | |
|
2736, 1997, 1683, 1654, 268
1196, 928, 799, 713, 169 |
2178, 1976, 1731, 1730, 281
915, 899, 832, 773, 179 |
 |
 |
| hookups: 1981 1984 1985 1986 1987 1988 1990 1991 1992 1993 1995 1997 1998 1999 2000 2001 2002 2003 2004 2005 2006 2007 2008 2009 2010 2011 | |
| dates: 1980 1981 1982 1985 1987 1989 1990 1991 1992 1993 1994 1995 1996 1997 1998 1999 2000 2001 2002 2003 2004 2005 2006 2007 2008 2009 2010 2011 | |
|
2085, 1412, 1176, 1124, 171
926, 637, 543, 479, 107 |
1539, 1337, 1150, 1136, 176
700, 592, 541, 494, 111 |
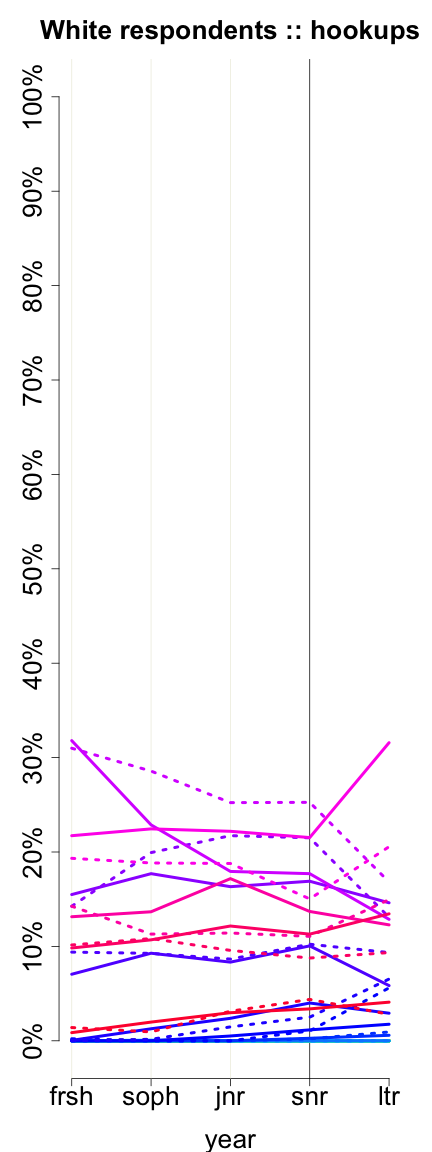
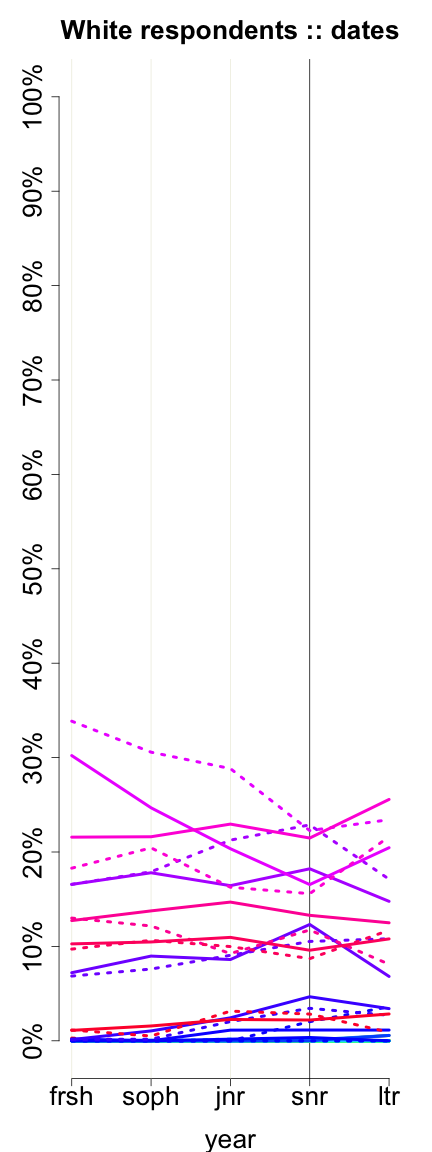
These graphs reflect only undergraduates attending 4-year colleges who are of normative age -- 18, 19, 20, 21, or 22, +/- 1, for freshman, sophomores, juniors, seniors, and later undergraduates, respectively. Solid lines represent women. Dotted lines represent men.
Previous column:
kind
Next column:
date
Previous alphabetically:
would.hookup.again
Next alphabetically:
you.had.an.orgasm