1187, 926, 792, 714, 169
928, 909, 834, 775, 179
489, 535, 597, 573, 143
By Column: Everything | Demographics | Sexual History | Attitudes | Relationships | Dating | Hookups
Alphabetically: Everything | Demographics | Sexual History | Attitudes | Relationships | Dating | Hookups
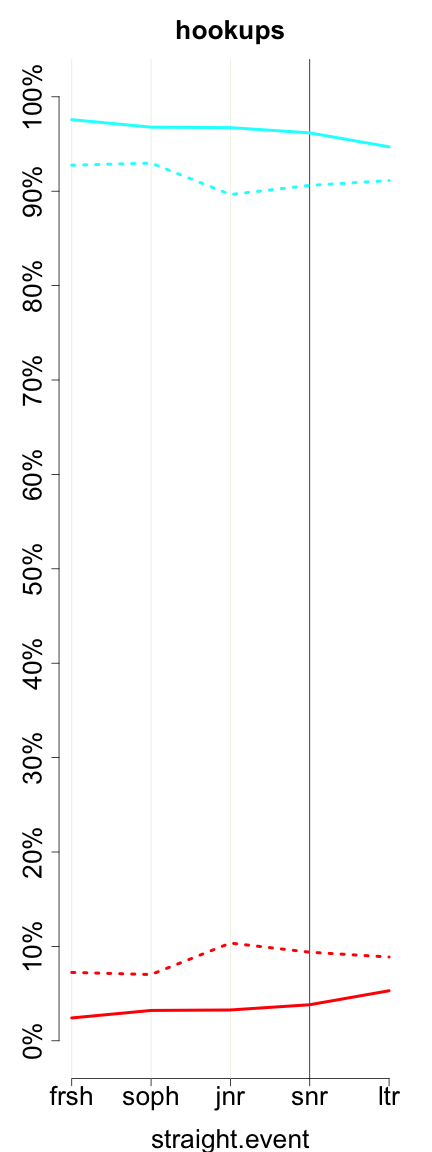
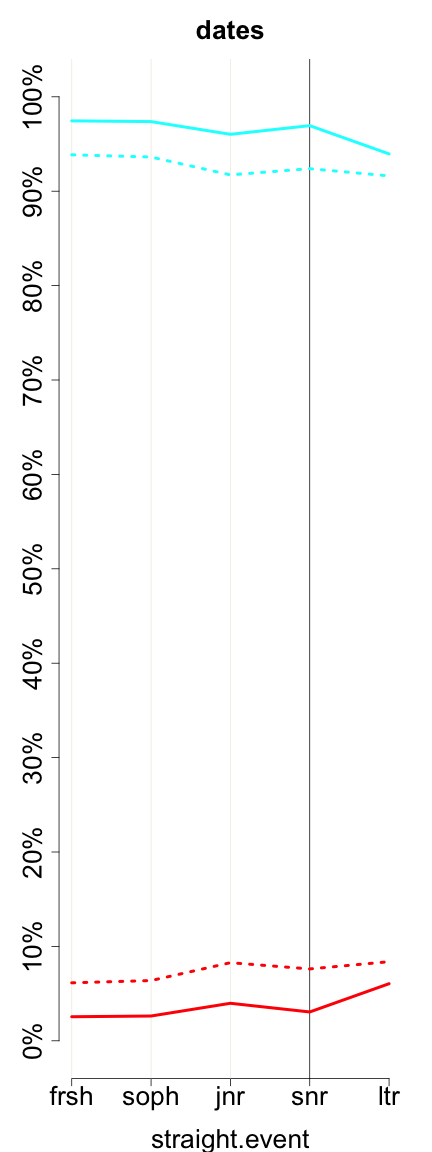
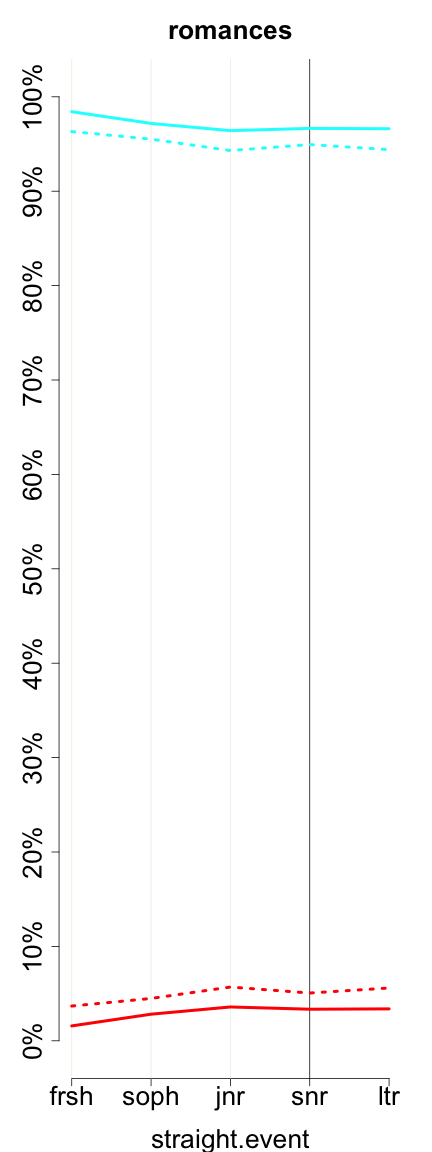
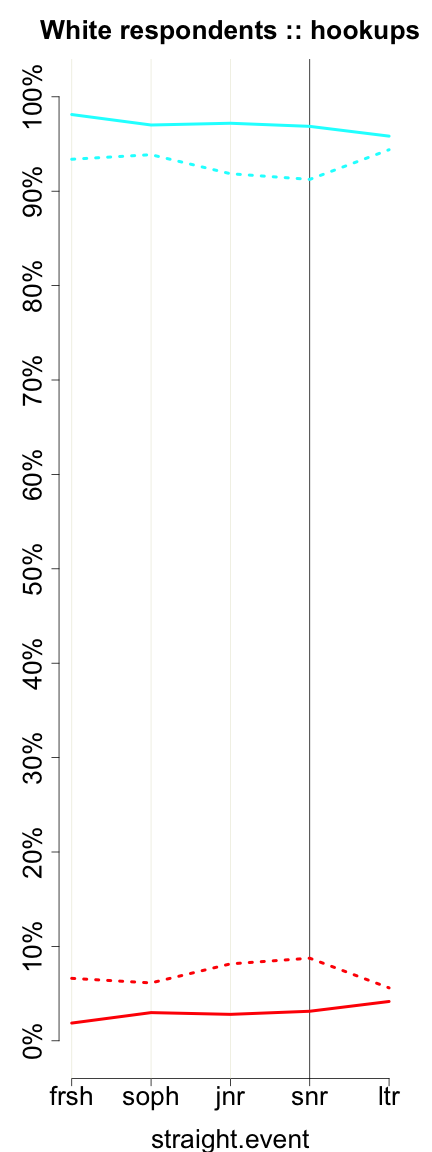
straight.event (in Dating, Hookups and Relationships)
| Variable Summary | Undergrad | Freshman | Sophomore | Junior | Senior |
| Sexually active students: | Undergrad | Freshman | Sophomore | Junior | Senior |
| Casual-sexually active students: | Undergrad | Freshman | Sophomore | Junior | Senior |
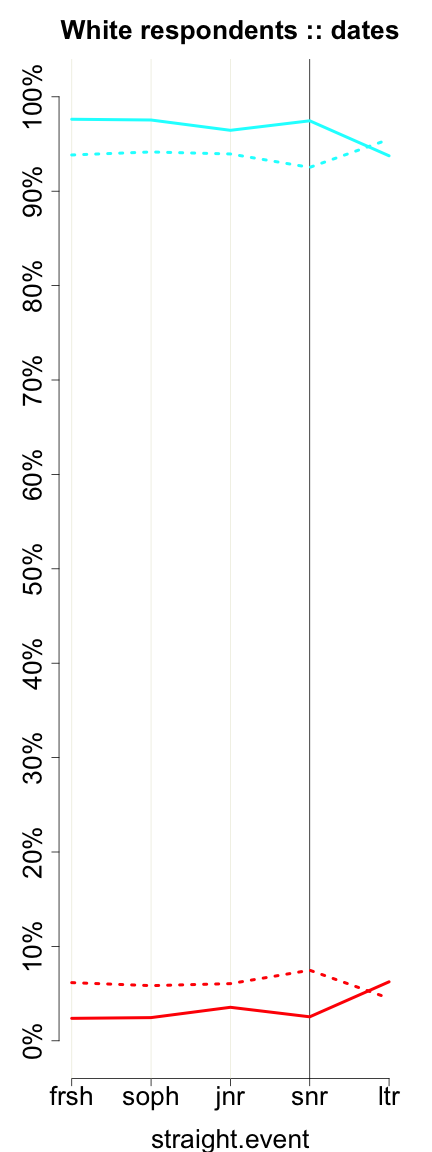
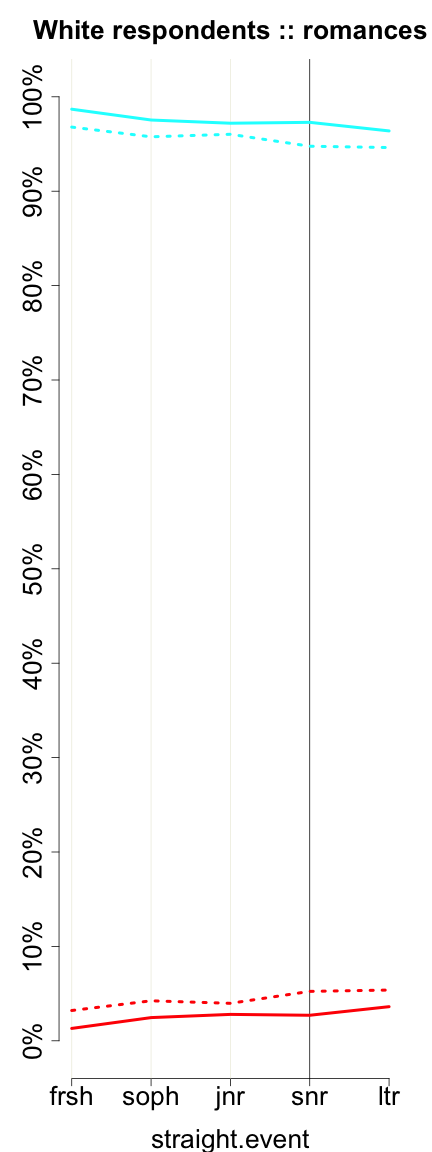
This variable indicates whether a date/hookup/relationship record is heterosexual.
This variable, straight.event, is constructed using information from the variable, gender.
This variable, straight.event, is used in the construction of the variables, boy.initiated, girl.initiated, who.initiated.r, boy.penetrated.girls.bottom, girl.penetrated.boys.bottom, anal.sex.r, boy.received.oral.sex, girl.received.oral.sex, boy.performed.oral.sex, girl.performed.oral.sex, condom.r, condom_r, condom.s, girl.asked, boy.asked, which.sex.paid, arranged.to.meet.r, arranged.to.meet.r.o, boy.contacted.girl.after, and girl.contacted.boy.after.
| hookups (straight_event or hookup__straight_event) | ||||||
| All Rs | Female | Male | ||||
| Mean (Std. Dev.) | 0.95 (0.22) | 0.97 (0.18) | 0.91 (0.28) | |||
| 0 | 764 | 5.22% | 334 | 3.38% | 405 | 8.54% |
| 1 | 13886 | 94.78% | 9546 | 96.62% | 4340 | 91.46% |
| Missing |
99
(0.67%) |
– |
39
(0.39%) |
– |
26
(0.54%) |
– |
| Total | 14749 | 100% | 9919 | 100% | 4771 | 100% |
| dates (straight_event or date__straight_event) | ||||||
| All Rs | Female | Male | ||||
| Mean (Std. Dev.) | 0.95 (0.21) | 0.97 (0.18) | 0.93 (0.26) | |||
| 0 | 683 | 4.74% | 326 | 3.36% | 332 | 7.07% |
| 1 | 13740 | 95.26% | 9374 | 96.64% | 4366 | 92.93% |
| Missing |
66
(0.46%) |
– |
26
(0.27%) |
– |
9
(0.19%) |
– |
| Total | 14489 | 100% | 9726 | 100% | 4707 | 100% |
| romances (straight_event or romance__straight_event) | ||||||
| All Rs | Female | Male | ||||
| Mean (Std. Dev.) | 0.96 (0.19) | 0.97 (0.17) | 0.95 (0.22) | |||
| 0 | 463 | 3.80% | 277 | 3.10% | 167 | 5.17% |
| 1 | 11734 | 96.20% | 8671 | 96.90% | 3063 | 94.83% |
| Missing |
95
(0.77%) |
– |
37
(0.41%) |
– |
30
(0.92%) |
– |
| Total | 12292 | 100% | 8985 | 100% | 3260 | 100% |
|
|
|
| Negative (no/false) Positive (yes/true) | ||
|
2727, 1990, 1684, 1649, 264
1187, 926, 792, 714, 169 |
2197, 1980, 1736, 1735, 281
928, 909, 834, 775, 179 |
1775, 1596, 1618, 1644, 266
489, 535, 597, 573, 143 |
 |
 |
 |
| Negative (no/false) Positive (yes/true) | ||
|
2077, 1406, 1178, 1118, 168
922, 636, 540, 480, 107 |
1556, 1343, 1155, 1141, 176
714, 599, 545, 495, 111 |
1220, 1017, 1072, 1072, 166
374, 354, 403, 382, 93 |
These graphs reflect only undergraduates attending 4-year colleges who are of normative age -- 18, 19, 20, 21, or 22, +/- 1, for freshman, sophomores, juniors, seniors, and later undergraduates, respectively. Solid lines represent women. Dotted lines represent men.
Previous column:
partner.gender
Next column:
partner.white
Previous alphabetically:
straight.childrearing
Next alphabetically:
survey.imputed.date