1165, 913, 783, 703, 163
925, 904, 822, 769, 178
490, 537, 596, 573, 143
By Column: Everything | Demographics | Sexual History | Attitudes | Relationships | Dating | Hookups
Alphabetically: Everything | Demographics | Sexual History | Attitudes | Relationships | Dating | Hookups
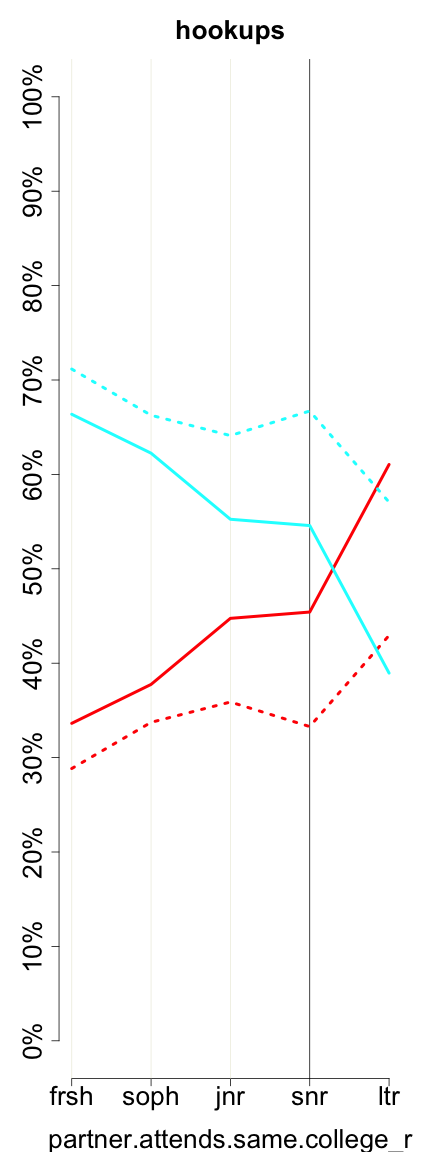
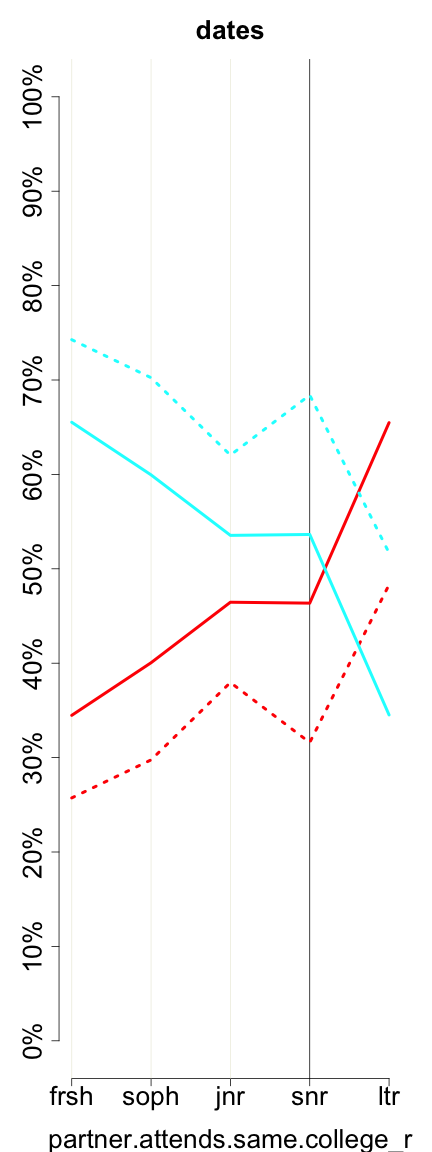
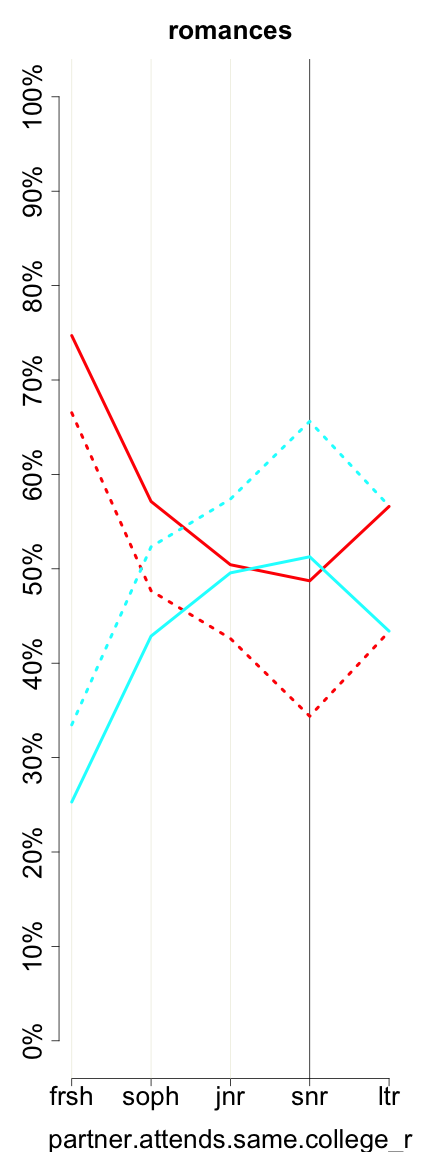
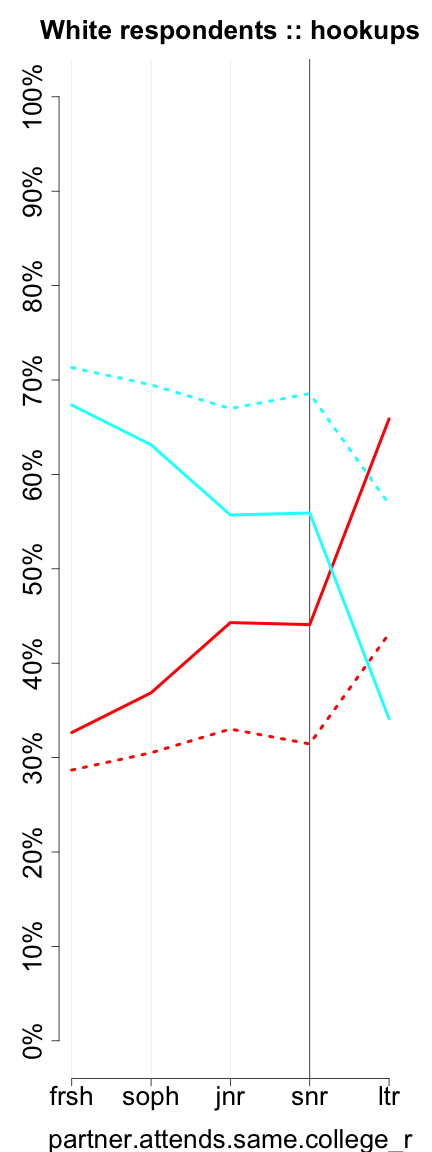
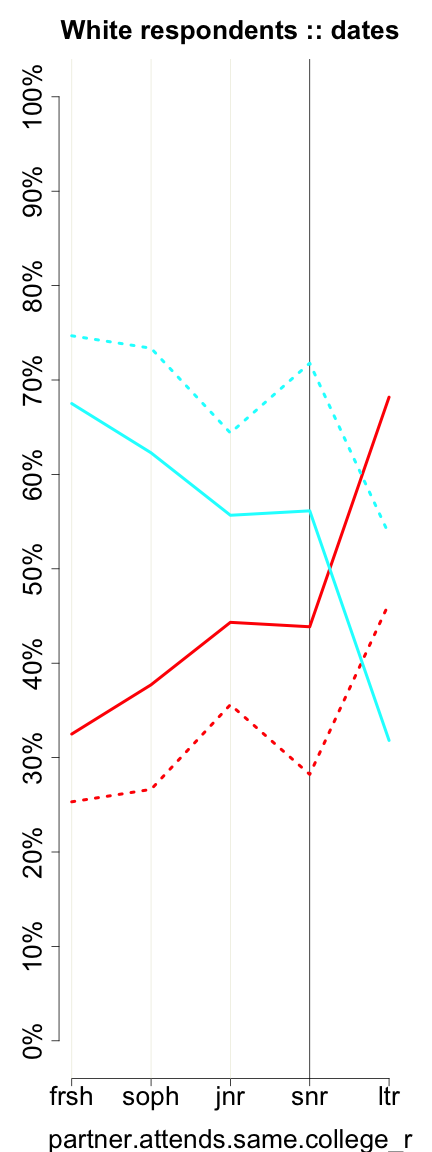
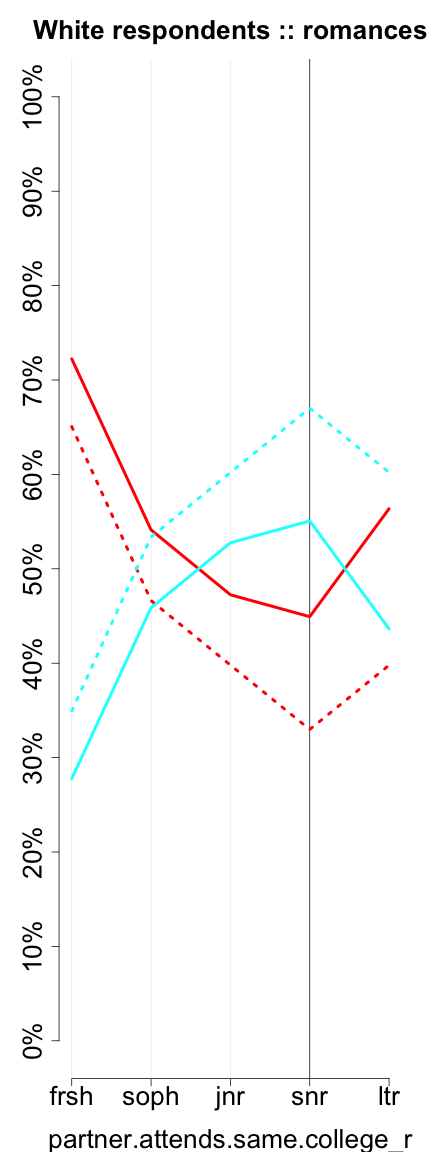
partner.attends.same.college_r (in Dating, Hookups and Relationships)
| Variable Summary | Undergrad | Freshman | Sophomore | Junior | Senior |
| Sexually active students: | Undergrad | Freshman | Sophomore | Junior | Senior |
| Casual-sexually active students: | Undergrad | Freshman | Sophomore | Junior | Senior |
This recodeds partner.attends.same.college, which, for dates and hookups, could be 'Don't know', and sets such cases to missing. I'm not quite sure this is the way to go about it, but it's necessary to match the regressions from the ASR2012 paper.
This variable, partner.attends.same.college_r, is constructed using information from the variable, partner.attends.same.college.
| hookups (partner_attends_same_college_r or h__p_a_s_c_r) | ||||||
| All Rs | Female | Male | ||||
| Mean (Std. Dev.) | 0.57 (0.50) | 0.55 (0.50) | 0.62 (0.49) | |||
| 0 | 6249 | 43.05% | 4438 | 45.27% | 1795 | 38.49% |
| 1 | 8265 | 56.95% | 5365 | 54.73% | 2868 | 61.51% |
| Missing |
235
(1.59%) |
– |
116
(1.17%) |
– |
108
(2.26%) |
– |
| Total | 14749 | 100% | 9919 | 100% | 4771 | 100% |
| dates (partner_attends_same_college_r or d__p_a_s_c_r) | ||||||
| All Rs | Female | Male | ||||
| Mean (Std. Dev.) | 0.56 (0.50) | 0.53 (0.50) | 0.62 (0.48) | |||
| 0 | 6323 | 43.92% | 4548 | 47.00% | 1754 | 37.62% |
| 1 | 8072 | 56.08% | 5129 | 53.00% | 2909 | 62.38% |
| Missing |
94
(0.65%) |
– |
49
(0.50%) |
– |
44
(0.93%) |
– |
| Total | 14489 | 100% | 9726 | 100% | 4707 | 100% |
| romances (partner_attends_same_college_r or r__p_a_s_c_r) | ||||||
| All Rs | Female | Male | ||||
| Mean (Std. Dev.) | 0.42 (0.49) | 0.39 (0.49) | 0.50 (0.50) | |||
| 0 | 7110 | 58.08% | 5465 | 60.99% | 1621 | 50.08% |
| 1 | 5132 | 41.92% | 3495 | 39.01% | 1616 | 49.92% |
| Missing |
50
(0.41%) |
– |
25
(0.28%) |
– |
23
(0.71%) |
– |
| Total | 12292 | 100% | 8985 | 100% | 3260 | 100% |
|
|
|
| Negative (no/false) Positive (yes/true) | ||
|
2703, 1976, 1667, 1638, 267
1165, 913, 783, 703, 163 |
2187, 1975, 1737, 1732, 281
925, 904, 822, 769, 178 |
1775, 1598, 1620, 1648, 265
490, 537, 596, 573, 143 |
 |
 |
 |
| Negative (no/false) Positive (yes/true) | ||
|
2058, 1397, 1167, 1116, 170
903, 626, 536, 477, 102 |
1551, 1339, 1155, 1140, 176
711, 597, 542, 489, 110 |
1221, 1018, 1073, 1075, 165
375, 356, 402, 382, 93 |
These graphs reflect only undergraduates attending 4-year colleges who are of normative age -- 18, 19, 20, 21, or 22, +/- 1, for freshman, sophomores, juniors, seniors, and later undergraduates, respectively. Solid lines represent women. Dotted lines represent men.
Previous column:
partner.attends.same.college
Next column:
partner.gender
Previous alphabetically:
partner.attends.same.college
Next alphabetically:
partner.black