1823, 1284, 1045, 873, 204
By Column: Everything | Demographics | Sexual History | Attitudes | Relationships | Dating | Hookups
Alphabetically: Everything | Demographics | Sexual History | Attitudes | Relationships | Dating | Hookups
marriage (in Demographics and Attitudes)
| Variable Summary | Undergrad | Freshman | Sophomore | Junior | Senior |
| Sexually active students: | Undergrad | Freshman | Sophomore | Junior | Senior |
| Casual-sexually active students: | Undergrad | Freshman | Sophomore | Junior | Senior |
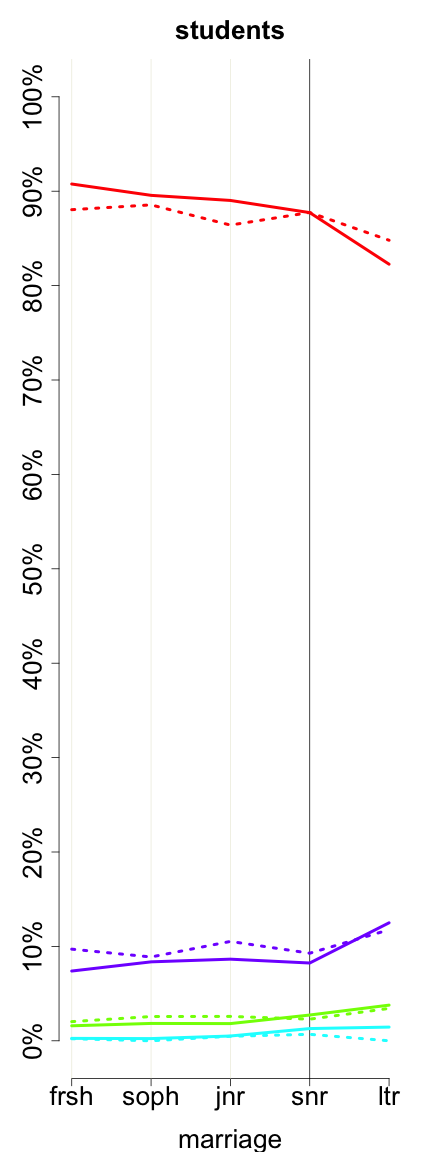
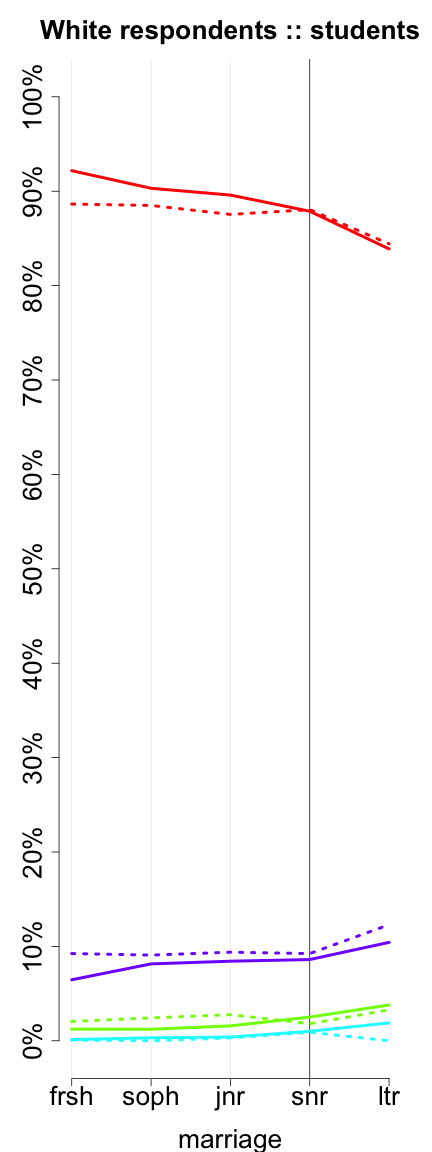
Do you want to get married in the future?
| students (marriage) | ||||||
| All Rs | Female | Male | ||||
| Yes, I would like to get married someday | 19152 | 85.95% | 13321 | 86.39% | 5762 | 85.07% |
| No, I would not like to get married someday | 506 | 2.27% | 326 | 2.11% | 175 | 2.58% |
| I am currently married | 620 | 2.78% | 479 | 3.11% | 136 | 2.01% |
| Don't know | 2005 | 9.00% | 1294 | 8.39% | 700 | 10.34% |
| Missing |
1848
(7.66%) |
– |
1059
(6.43%) |
– |
688
(9.22%) |
– |
| Total | 24131 | 100% | 16479 | 100% | 7461 | 100% |
|
| Yes, I would like to get married someday No, I would not like to get married someday I am currently married Don't know |
|
4655, 2989, 2359, 2160, 344
1823, 1284, 1045, 873, 204 |
 |
| Yes, I would like to get married someday No, I would not like to get married someday I am currently married Don't know |
|
3156, 1878, 1518, 1394, 211
1320, 782, 650, 552, 122 |
These graphs reflect only undergraduates attending 4-year colleges who are of normative age -- 18, 19, 20, 21, or 22, +/- 1, for freshman, sophomores, juniors, seniors, and later undergraduates, respectively. Solid lines represent women. Dotted lines represent men.
Previous column:
abortion.is.okay.if.health.is.at.risk
Next column:
exclusivity
Previous alphabetically:
marital.childrearing.inequality
Next alphabetically:
meth