2013, 1410, 1141, 971, 216
By Column: Everything | Demographics | Sexual History | Attitudes | Relationships | Dating | Hookups
Alphabetically: Everything | Demographics | Sexual History | Attitudes | Relationships | Dating | Hookups
marital.childrearing.inequality (in Attitudes)
| Variable Summary | Undergrad | Freshman | Sophomore | Junior | Senior |
| Sexually active students: | Undergrad | Freshman | Sophomore | Junior | Senior |
| Casual-sexually active students: | Undergrad | Freshman | Sophomore | Junior | Senior |
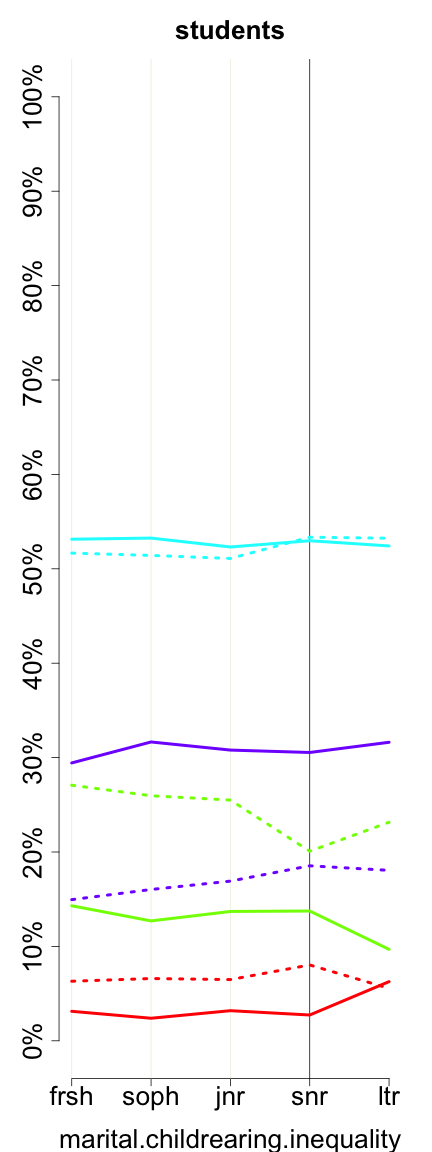
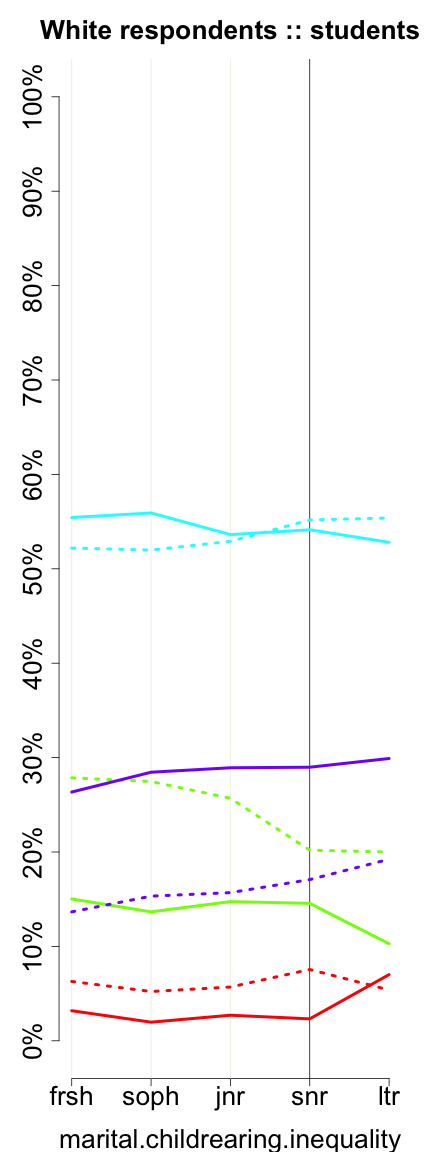
In a marriage, it is best if one person has the main career and the other is in charge of children and household.
| students (m_c_i) | ||||||
| All Rs | Female | Male | ||||
| Strongly agree | 1026 | 4.32% | 515 | 3.16% | 508 | 6.90% |
| Agree | 4192 | 17.64% | 2334 | 14.30% | 1842 | 25.03% |
| Disagree | 12373 | 52.05% | 8563 | 52.48% | 3767 | 51.20% |
| Strongly disagree | 6179 | 25.99% | 4904 | 30.06% | 1241 | 16.87% |
| Missing |
361
(1.50%) |
– |
163
(0.99%) |
– |
103
(1.38%) |
– |
| Total | 24131 | 100% | 16479 | 100% | 7461 | 100% |
|
| Strongly agree Agree Disagree Strongly disagree |
|
5089, 3181, 2445, 2269, 351
2013, 1410, 1141, 971, 216 |
 |
| Strongly agree Agree Disagree Strongly disagree |
|
3514, 2028, 1587, 1463, 214
1479, 881, 720, 609, 130 |
These graphs reflect only undergraduates attending 4-year colleges who are of normative age -- 18, 19, 20, 21, or 22, +/- 1, for freshman, sophomores, juniors, seniors, and later undergraduates, respectively. Solid lines represent women. Dotted lines represent men.
Previous column:
marital.childrearing.equality
Next column:
on.campus.dating.opportunities
Previous alphabetically:
marital.childrearing.equality
Next alphabetically:
marriage