2021, 1414, 1149, 976, 214
By Column: Everything | Demographics | Sexual History | Attitudes | Relationships | Dating | Hookups
Alphabetically: Everything | Demographics | Sexual History | Attitudes | Relationships | Dating | Hookups
times.partner.rejected.exclusivity (in Sexual History)
| Variable Summary | Undergrad | Freshman | Sophomore | Junior | Senior |
| Sexually active students: | Undergrad | Freshman | Sophomore | Junior | Senior |
| Casual-sexually active students: | Undergrad | Freshman | Sophomore | Junior | Senior |
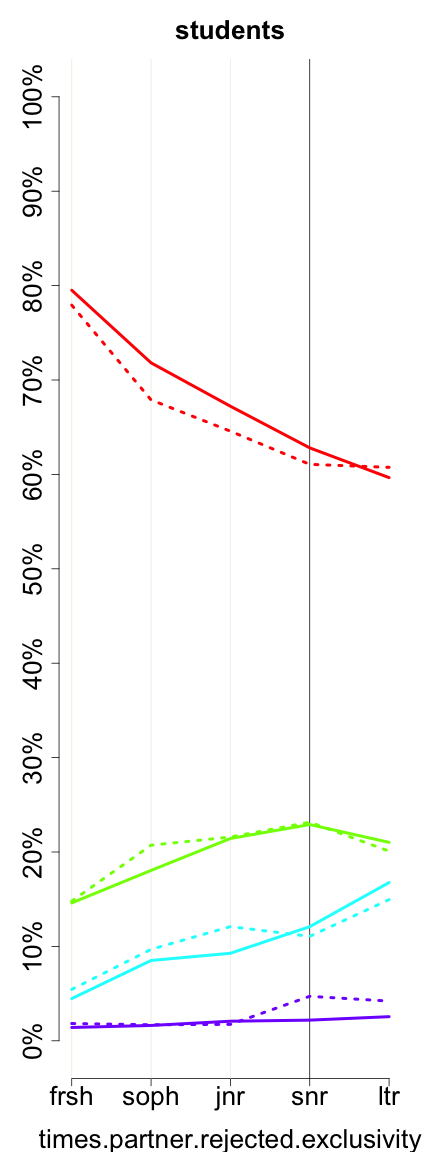
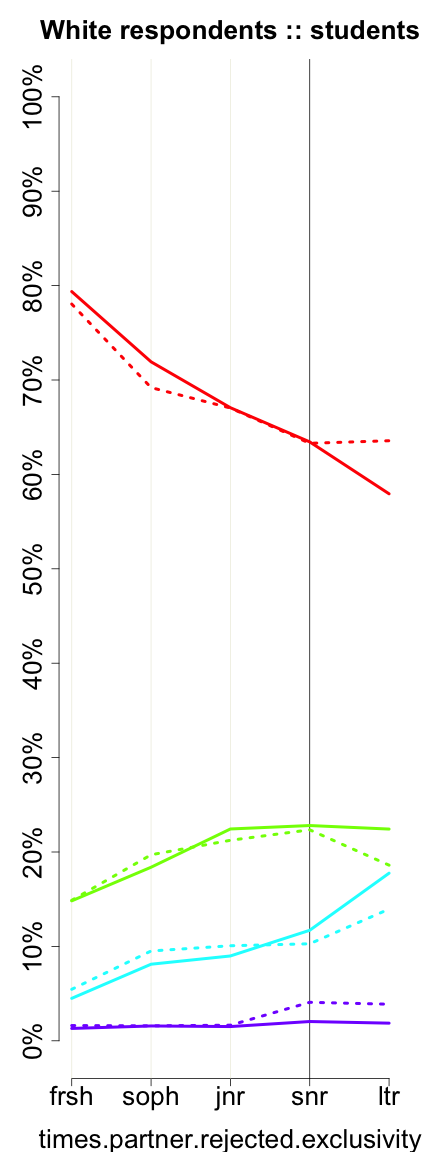
Since you started college, how many times have you initiated such a talk, and had the other person respond that they didn't want an exclusive relationship now?
| students (t_p_r_e) | ||||||
| All Rs | Female | Male | ||||
| Never | 16855 | 70.69% | 11730 | 71.66% | 5063 | 68.56% |
| 1 | 4468 | 18.74% | 3031 | 18.52% | 1417 | 19.19% |
| 2-3 | 2032 | 8.52% | 1320 | 8.06% | 708 | 9.59% |
| 4+ | 490 | 2.05% | 288 | 1.76% | 197 | 2.67% |
| Missing |
286
(1.19%) |
– |
110
(0.67%) |
– |
76
(1.02%) |
– |
| Total | 24131 | 100% | 16479 | 100% | 7461 | 100% |
|
| Never 1 2-3 4+ |
|
5100, 3197, 2459, 2283, 352
2021, 1414, 1149, 976, 214 |
 |
| Never 1 2-3 4+ |
|
3514, 2034, 1591, 1469, 214
1485, 883, 725, 613, 129 |
These graphs reflect only undergraduates attending 4-year colleges who are of normative age -- 18, 19, 20, 21, or 22, +/- 1, for freshman, sophomores, juniors, seniors, and later undergraduates, respectively. Solid lines represent women. Dotted lines represent men.
Previous column:
typically.call.after.hookup.just.to.be.polite.event.if.no.interest
Next column:
times.you.rejected.exclusivity
Previous alphabetically:
time.since
Next alphabetically:
times.you.rejected.exclusivity