2038, 1430, 1160, 980, 216
By Column: Everything | Demographics | Sexual History | Attitudes | Relationships | Dating | Hookups
Alphabetically: Everything | Demographics | Sexual History | Attitudes | Relationships | Dating | Hookups
school (in Demographics)
| Variable Summary | Undergrad | Freshman | Sophomore | Junior | Senior |
| Sexually active students: | Undergrad | Freshman | Sophomore | Junior | Senior |
| Casual-sexually active students: | Undergrad | Freshman | Sophomore | Junior | Senior |
This variable links the student to a college, using (as far as I understand) the class-specific passwords the students logged in with.
This variable, school, is used in the construction of the variable, school.kind.
| students (school) | ||||||
| All Rs | Female | Male | ||||
| Stanford | 1457 | 6.04% | 800 | 4.85% | 621 | 8.32% |
| Indiana | 1115 | 4.62% | 756 | 4.59% | 350 | 4.69% |
| Arizona | 1515 | 6.28% | 1055 | 6.40% | 448 | 6.00% |
| Stonybrook | 948 | 3.93% | 657 | 3.99% | 282 | 3.78% |
| Ithaca | 545 | 2.26% | 372 | 2.26% | 164 | 2.20% |
| Evergreen | 102 | 0.42% | 74 | 0.45% | 24 | 0.32% |
| UCSB | 3084 | 12.78% | 2372 | 14.39% | 689 | 9.23% |
| U Mass | 3607 | 14.95% | 2236 | 13.57% | 1355 | 18.16% |
| Ohio State | 1345 | 5.57% | 951 | 5.77% | 389 | 5.21% |
| Whitman | 1182 | 4.90% | 785 | 4.76% | 390 | 5.23% |
| Foothill College | 2631 | 10.90% | 1787 | 10.84% | 828 | 11.10% |
| Harvard | 182 | 0.75% | 116 | 0.70% | 65 | 0.87% |
| UI-Chicago | 2027 | 8.40% | 1426 | 8.65% | 590 | 7.91% |
| Framingham | 1052 | 4.36% | 834 | 5.06% | 215 | 2.88% |
| Radford | 110 | 0.46% | 77 | 0.47% | 33 | 0.44% |
| Beloit | 205 | 0.85% | 151 | 0.92% | 52 | 0.70% |
| UC-Riverside | 1183 | 4.90% | 758 | 4.60% | 413 | 5.54% |
| Penn | 487 | 2.02% | 316 | 1.92% | 161 | 2.16% |
| Washington | 587 | 2.43% | 405 | 2.46% | 182 | 2.44% |
| UC Merced | 173 | 0.72% | 119 | 0.72% | 50 | 0.67% |
| MTSU | 434 | 1.80% | 324 | 1.97% | 108 | 1.45% |
| Carroll | 160 | 0.66% | 108 | 0.66% | 52 | 0.70% |
| Missing |
0
(0.00%) |
– |
0
(0.00%) |
– |
0
(0.00%) |
– |
| Total | 24131 | 100% | 16479 | 100% | 7461 | 100% |
|
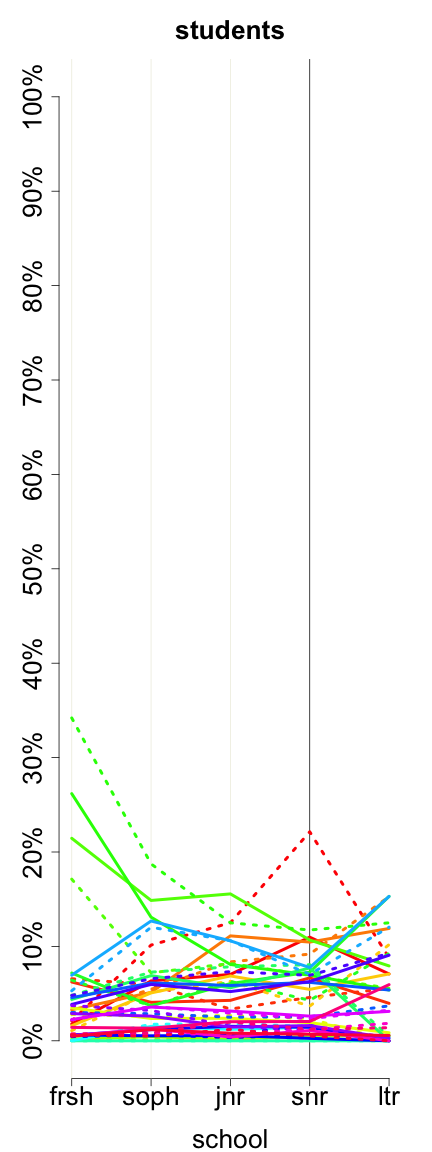
| Stanford Indiana Arizona Stonybrook Ithaca Evergreen UCSB U Mass Ohio State Whitman Foothill College Harvard UI-Chicago Framingham Radford Beloit UC-Riverside Penn Washington UC Merced MTSU Carroll |
|
5137, 3215, 2474, 2295, 353
2038, 1430, 1160, 980, 216 |
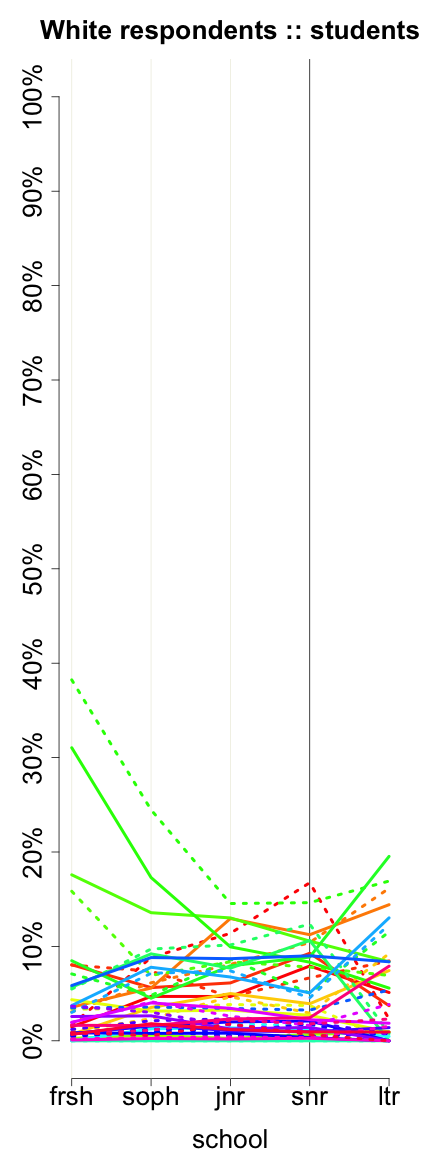 |
| Stanford Indiana Arizona Stonybrook Ithaca Evergreen UCSB U Mass Ohio State Whitman Foothill College Harvard UI-Chicago Framingham Radford Beloit UC-Riverside Penn Washington UC Merced MTSU Carroll |
|
3537, 2041, 1598, 1477, 215
1496, 895, 729, 615, 130 |
These graphs reflect only undergraduates attending 4-year colleges who are of normative age -- 18, 19, 20, 21, or 22, +/- 1, for freshman, sophomores, juniors, seniors, and later undergraduates, respectively. Solid lines represent women. Dotted lines represent men.
Previous column:
survey.imputed.date
Next column:
party.school
Previous alphabetically:
same.sex.sex
Next alphabetically:
school.kind