826, 600, 499, 468, 90
687, 635, 509, 522, 92
164, 280, 342, 366, 80
By Column: Everything | Demographics | Sexual History | Attitudes | Relationships | Dating | Hookups
Alphabetically: Everything | Demographics | Sexual History | Attitudes | Relationships | Dating | Hookups
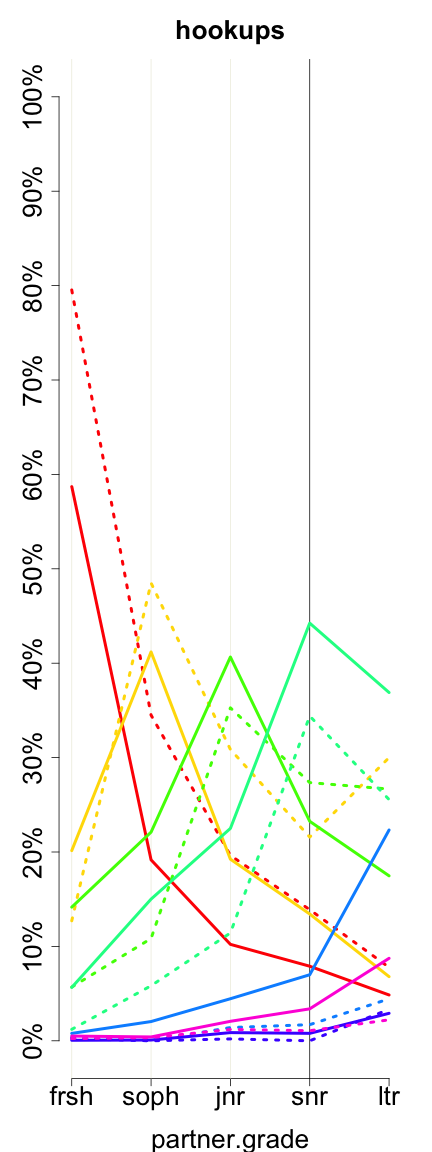
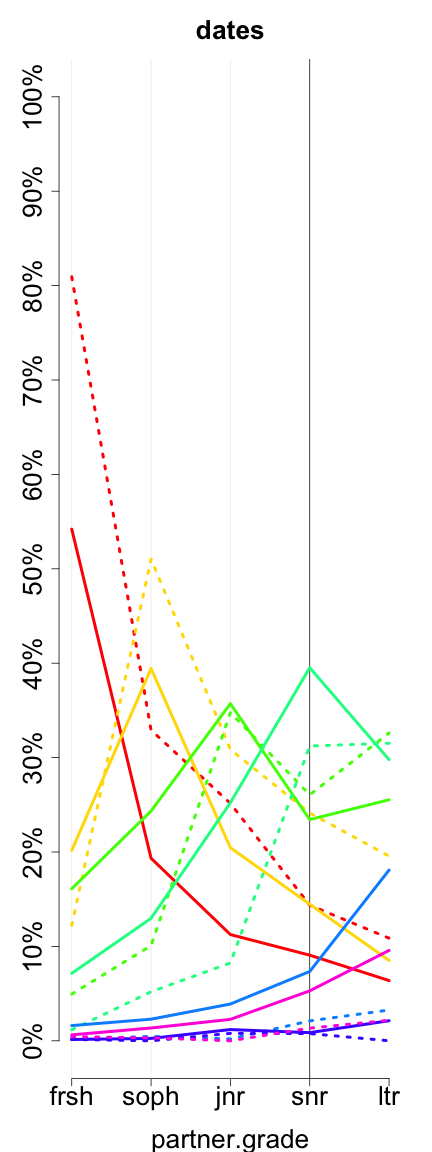
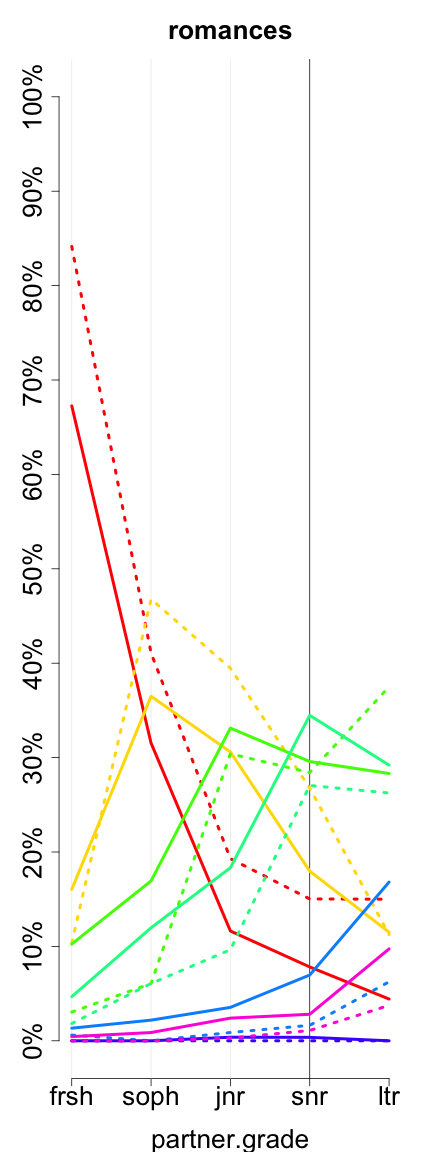
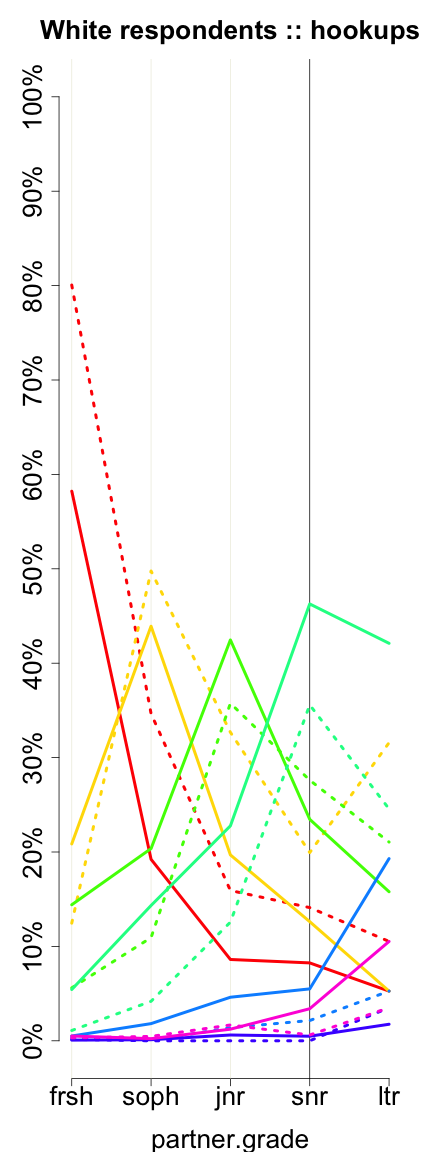
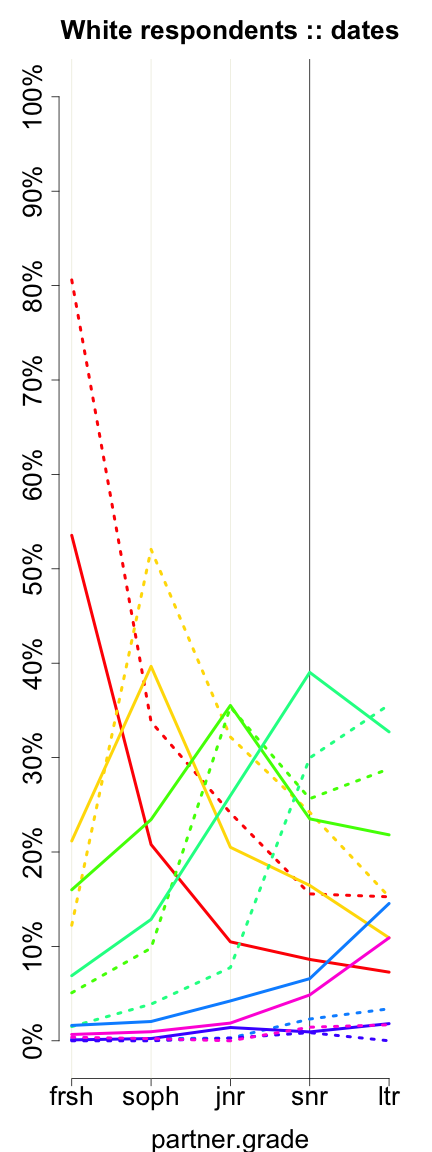
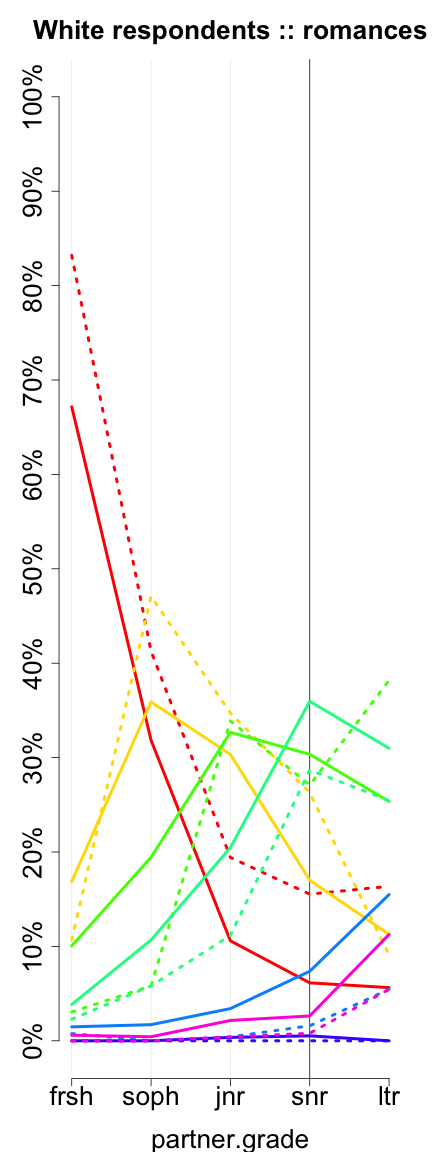
partner.grade (in Dating, Hookups and Relationships)
| Variable Summary | Undergrad | Freshman | Sophomore | Junior | Senior |
| Sexually active students: | Undergrad | Freshman | Sophomore | Junior | Senior |
| Casual-sexually active students: | Undergrad | Freshman | Sophomore | Junior | Senior |
For dates and hookups: If {your date/the person you hooked up with} was a student at your college, what was his/her year? For relationships: What was your significant other's college year during most of the relationship?
| hookups (partner_grade or hookup__partner_grade) | ||||||
| All Rs | Female | Male | ||||
| Freshman | 2664 | 32.40% | 1521 | 28.49% | 1134 | 39.78% |
| Sophomore | 2086 | 25.37% | 1287 | 24.11% | 784 | 27.50% |
| Junior | 1740 | 21.16% | 1213 | 22.72% | 521 | 18.27% |
| Senior | 1363 | 16.58% | 1016 | 19.03% | 346 | 12.14% |
| Later undergraduate | 214 | 2.60% | 184 | 3.45% | 30 | 1.05% |
| Graduate--Business (MBA) | 28 | 0.34% | 20 | 0.37% | 8 | 0.28% |
| Graduate--All Others | 127 | 1.54% | 98 | 1.84% | 28 | 0.98% |
| Missing |
6527
(44.25%) |
– |
4580
(46.17%) |
– |
1920
(40.24%) |
– |
| Total | 14749 | 100% | 9919 | 100% | 4771 | 100% |
| dates (partner_grade or date__partner_grade) | ||||||
| All Rs | Female | Male | ||||
| Freshman | 2405 | 29.94% | 1290 | 25.30% | 1103 | 38.01% |
| Sophomore | 2137 | 26.60% | 1264 | 24.79% | 862 | 29.70% |
| Junior | 1745 | 21.72% | 1209 | 23.71% | 532 | 18.33% |
| Senior | 1314 | 16.36% | 976 | 19.14% | 337 | 11.61% |
| Later undergraduate | 231 | 2.88% | 199 | 3.90% | 31 | 1.07% |
| Graduate--Business (MBA) | 41 | 0.51% | 28 | 0.55% | 11 | 0.38% |
| Graduate--All Others | 160 | 1.99% | 133 | 2.61% | 26 | 0.90% |
| Missing |
6456
(44.56%) |
– |
4627
(47.57%) |
– |
1805
(38.35%) |
– |
| Total | 14489 | 100% | 9726 | 100% | 4707 | 100% |
| romances (partner_grade or romance__partner_grade) | ||||||
| All Rs | Female | Male | ||||
| Freshman | 1313 | 25.91% | 812 | 23.56% | 494 | 30.88% |
| Sophomore | 1362 | 26.88% | 872 | 25.30% | 485 | 30.31% |
| Junior | 1161 | 22.91% | 824 | 23.91% | 336 | 21.00% |
| Senior | 880 | 17.37% | 658 | 19.09% | 218 | 13.63% |
| Later undergraduate | 198 | 3.91% | 167 | 4.85% | 28 | 1.75% |
| Graduate--Business (MBA) | 14 | 0.28% | 12 | 0.35% | 2 | 0.12% |
| Graduate--All Others | 139 | 2.74% | 101 | 2.93% | 37 | 2.31% |
| Missing |
7225
(58.78%) |
– |
5539
(61.65%) |
– |
1660
(50.92%) |
– |
| Total | 12292 | 100% | 8985 | 100% | 3260 | 100% |
|
|
|
| Freshman Sophomore Junior Senior Later undergraduate Graduate--Business (MBA) Graduate--All Others | ||
|
1787, 1226, 920, 886, 103
826, 600, 499, 468, 90 |
1428, 1179, 924, 926, 94
687, 635, 509, 522, 92 |
449, 685, 791, 818, 113
164, 280, 342, 366, 80 |
 |
 |
 |
| Freshman Sophomore Junior Senior Later undergraduate Graduate--Business (MBA) Graduate--All Others | ||
|
1381, 879, 650, 618, 57
642, 430, 358, 326, 57 |
1044, 832, 639, 638, 55
531, 438, 348, 347, 59 |
338, 468, 557, 570, 71
131, 189, 242, 251, 55 |
These graphs reflect only undergraduates attending 4-year colleges who are of normative age -- 18, 19, 20, 21, or 22, +/- 1, for freshman, sophomores, juniors, seniors, and later undergraduates, respectively. Solid lines represent women. Dotted lines represent men.
Previous column:
partner.race.specify
Next column:
first.met.at
Previous alphabetically:
partner.gender
Next alphabetically:
partner.had.an.orgasm