2038, 1430, 1160, 980, 216
By Column: Everything | Demographics | Sexual History | Attitudes | Relationships | Dating | Hookups
Alphabetically: Everything | Demographics | Sexual History | Attitudes | Relationships | Dating | Hookups
native.american (in Demographics)
| Variable Summary | Undergrad | Freshman | Sophomore | Junior | Senior |
| Sexually active students: | Undergrad | Freshman | Sophomore | Junior | Senior |
| Casual-sexually active students: | Undergrad | Freshman | Sophomore | Junior | Senior |
Which of these racial or ethnic groups describes you? (check all that apply) -- Note that other.race, asian, and hispanic are collapsed versions of the preceding more detailed categories. (See also race, where students were asked to pick one.)
The same question also applies to the variables, white, black, chinese, japanese, korean, filipino, vietnamese, south.asian, other.asian, mexican, puerto.rican, other.hispanic, other.race.but.not.native.american, race.specify, other.race, asian, and hispanic.
This variable, native.american, is used in the construction of the variable, other.race.
| students (native_american) | ||||||
| All Rs | Female | Male | ||||
| Mean (Std. Dev.) | 0.03 (0.17) | 0.03 (0.18) | 0.03 (0.16) | |||
| 0 | 23375 | 96.87% | 15930 | 96.67% | 7256 | 97.25% |
| 1 | 756 | 3.13% | 549 | 3.33% | 205 | 2.75% |
| Missing |
0
(0.00%) |
– |
0
(0.00%) |
– |
0
(0.00%) |
– |
| Total | 24131 | 100% | 16479 | 100% | 7461 | 100% |
|
| Negative (no/false) Positive (yes/true) |
|
5137, 3215, 2474, 2295, 353
2038, 1430, 1160, 980, 216 |
 |
| Negative (no/false) Positive (yes/true) |
|
3537, 2041, 1598, 1477, 215
1496, 895, 729, 615, 130 |
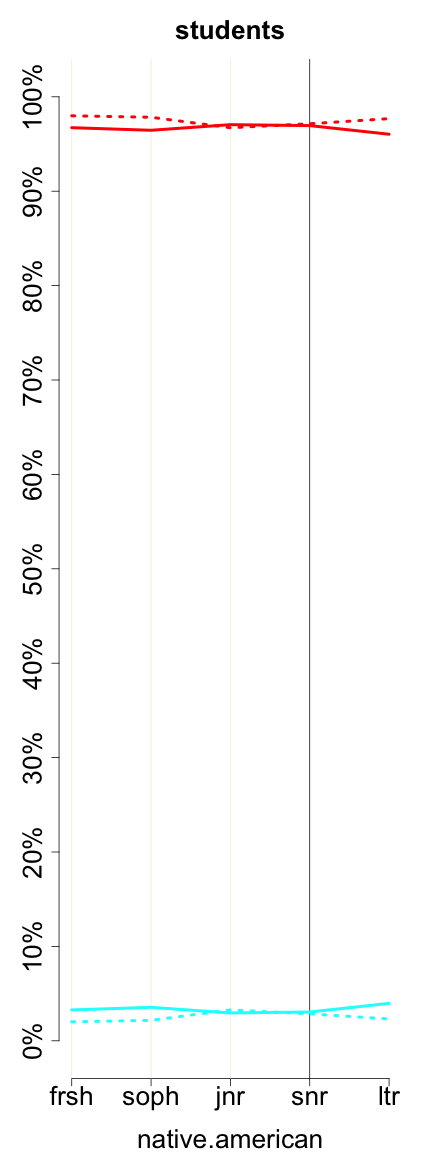
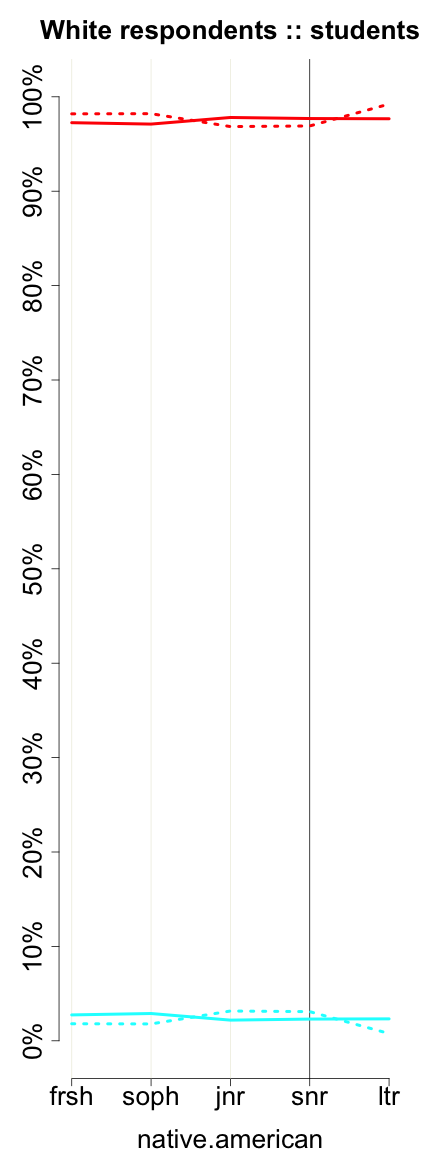
These graphs reflect only undergraduates attending 4-year colleges who are of normative age -- 18, 19, 20, 21, or 22, +/- 1, for freshman, sophomores, juniors, seniors, and later undergraduates, respectively. Solid lines represent women. Dotted lines represent men.
Previous column:
hispanic
Next column:
other.race.but.not.native.american
Previous alphabetically:
mothers.education.r
Next alphabetically:
no.drugs