2038, 1430, 1160, 980, 216
By Column: Everything | Demographics | Sexual History | Attitudes | Relationships | Dating | Hookups
Alphabetically: Everything | Demographics | Sexual History | Attitudes | Relationships | Dating | Hookups
is.traditional.age (in Demographics)
| Variable Summary | Undergrad | Freshman | Sophomore | Junior | Senior |
| Sexually active students: | Undergrad | Freshman | Sophomore | Junior | Senior |
| Casual-sexually active students: | Undergrad | Freshman | Sophomore | Junior | Senior |
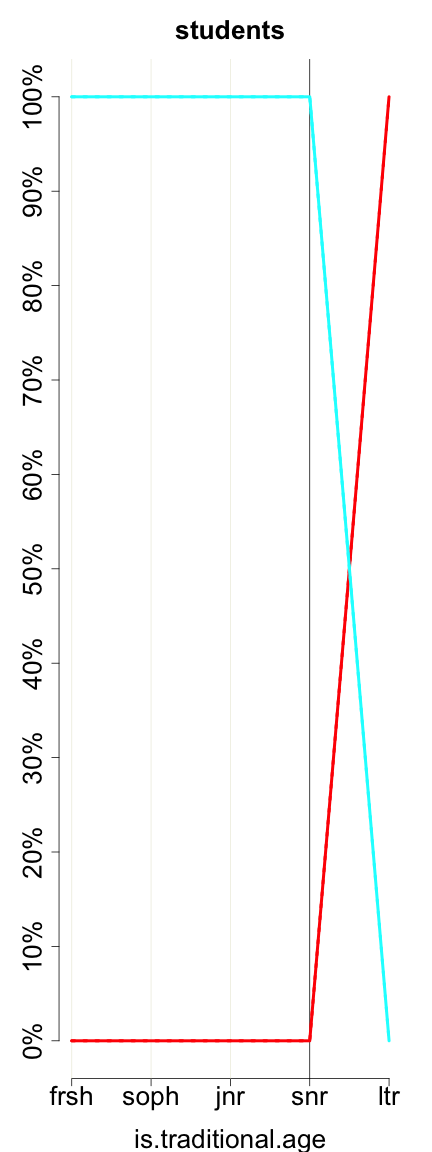
I coded these such that: freshman are 18, sophomores 19, juniors 20, and seniors 21, all +/- 1. This looks for students in their 1st-4th years of college (so it's false for 5th-year students).
This variable, is.traditional.age, is constructed using information from the variables, grade and age.
| students (is_traditional_age) | ||||||
| All Rs | Female | Male | ||||
| FALSE | 3802 | 15.89% | 2414 | 14.70% | 1368 | 18.39% |
| TRUE | 20131 | 84.11% | 14013 | 85.30% | 6069 | 81.61% |
| Missing |
198
(0.82%) |
– |
52
(0.32%) |
– |
24
(0.32%) |
– |
| Total | 24131 | 100% | 16479 | 100% | 7461 | 100% |
|
| Negative (no/false) Positive (yes/true) |
|
5137, 3215, 2474, 2295, 353
2038, 1430, 1160, 980, 216 |
 |
| Negative (no/false) Positive (yes/true) |
|
3537, 2041, 1598, 1477, 215
1496, 895, 729, 615, 130 |
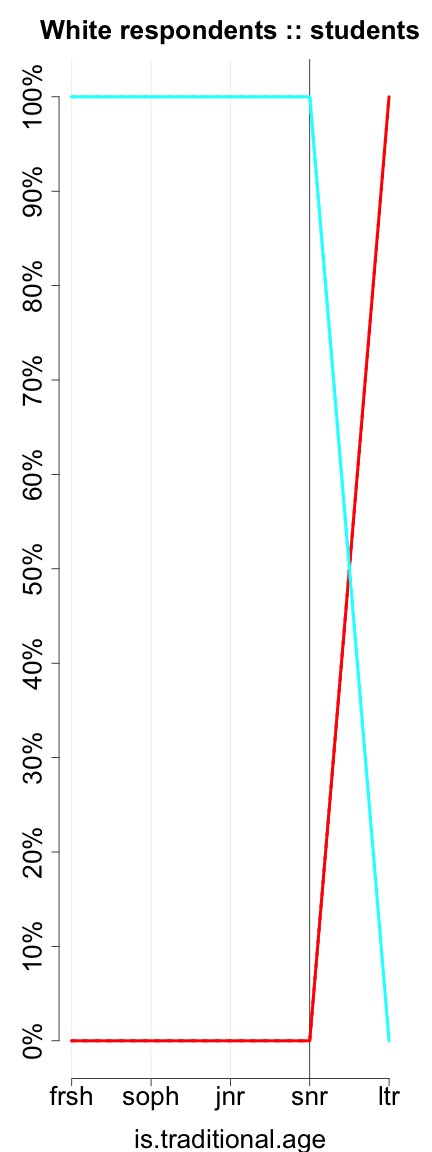
These graphs reflect only undergraduates attending 4-year colleges who are of normative age -- 18, 19, 20, 21, or 22, +/- 1, for freshman, sophomores, juniors, seniors, and later undergraduates, respectively. Solid lines represent women. Dotted lines represent men.
Previous column:
grade.cc
Next column:
bio.sex
Previous alphabetically:
interested.the.day.before.hookup
Next alphabetically:
japanese