2038, 1430, 1160, 980, 216
By Column: Everything | Demographics | Sexual History | Attitudes | Relationships | Dating | Hookups
Alphabetically: Everything | Demographics | Sexual History | Attitudes | Relationships | Dating | Hookups
height.in.inches (in Demographics)
| Variable Summary | Undergrad | Freshman | Sophomore | Junior | Senior |
| Sexually active students: | Undergrad | Freshman | Sophomore | Junior | Senior |
| Casual-sexually active students: | Undergrad | Freshman | Sophomore | Junior | Senior |
What is your height? -- Note that this variable is in inches, though the questionnaire included separate fields for feet and inches.
This variable, height.in.inches, is used in the construction of the variable, bmi.
| students (height_in_inches) | ||||||
| All Rs | Female | Male | ||||
| Mean (Std. Dev.) | 66.64 (37.98) | 62.73 (31.71) | 76.23 (47.32) | |||
| 0 | 19 | 0.08% | 0 | 0.00% | 0 | 0.00% |
| 4 | 153 | 0.63% | 44 | 0.27% | 12 | 0.16% |
| 5 | 640 | 2.65% | 634 | 3.85% | 5 | 0.07% |
| 6 | 1149 | 4.76% | 68 | 0.41% | 1074 | 14.39% |
| 7 | 4 | 0.02% | 1 | 0.01% | 3 | 0.04% |
| 16 | 2 | 0.01% | 2 | 0.01% | 0 | 0.00% |
| 17 | 888 | 3.68% | 878 | 5.33% | 6 | 0.08% |
| 18 | 628 | 2.60% | 29 | 0.18% | 597 | 8.00% |
| 28 | 4 | 0.02% | 4 | 0.02% | 0 | 0.00% |
| 29 | 1815 | 7.52% | 1791 | 10.87% | 20 | 0.27% |
| 30 | 573 | 2.37% | 16 | 0.10% | 556 | 7.45% |
| 40 | 6 | 0.02% | 5 | 0.03% | 0 | 0.00% |
| 41 | 2141 | 8.87% | 2095 | 12.71% | 41 | 0.55% |
| 42 | 329 | 1.36% | 8 | 0.05% | 321 | 4.30% |
| 52 | 8 | 0.03% | 8 | 0.05% | 0 | 0.00% |
| 53 | 2470 | 10.24% | 2374 | 14.41% | 91 | 1.22% |
| 54 | 178 | 0.74% | 5 | 0.03% | 173 | 2.32% |
| 64 | 16 | 0.07% | 14 | 0.08% | 1 | 0.01% |
| 65 | 2194 | 9.09% | 2051 | 12.45% | 141 | 1.89% |
| 66 | 87 | 0.36% | 4 | 0.02% | 83 | 1.11% |
| 67 | 4 | 0.02% | 3 | 0.02% | 1 | 0.01% |
| 76 | 3 | 0.01% | 2 | 0.01% | 1 | 0.01% |
| 77 | 2326 | 9.64% | 2020 | 12.26% | 302 | 4.05% |
| 78 | 50 | 0.21% | 3 | 0.02% | 47 | 0.63% |
| 88 | 1 | 0.00% | 1 | 0.01% | 0 | 0.00% |
| 89 | 2335 | 9.68% | 1748 | 10.61% | 576 | 7.72% |
| 90 | 26 | 0.11% | 3 | 0.02% | 23 | 0.31% |
| 100 | 12 | 0.05% | 11 | 0.07% | 1 | 0.01% |
| 101 | 1764 | 7.31% | 1103 | 6.69% | 650 | 8.71% |
| 102 | 9 | 0.04% | 0 | 0.00% | 9 | 0.12% |
| 103 | 1 | 0.00% | 0 | 0.00% | 1 | 0.01% |
| 112 | 24 | 0.10% | 24 | 0.15% | 0 | 0.00% |
| 113 | 1442 | 5.98% | 687 | 4.17% | 750 | 10.05% |
| 114 | 9 | 0.04% | 2 | 0.01% | 7 | 0.09% |
| 124 | 48 | 0.20% | 47 | 0.29% | 1 | 0.01% |
| 125 | 1457 | 6.04% | 418 | 2.54% | 1032 | 13.83% |
| 126 | 2 | 0.01% | 0 | 0.00% | 2 | 0.03% |
| 136 | 203 | 0.84% | 203 | 1.23% | 0 | 0.00% |
| 137 | 1110 | 4.60% | 173 | 1.05% | 933 | 12.51% |
| 138 | 1 | 0.00% | 0 | 0.00% | 1 | 0.01% |
| Missing |
0
(0.00%) |
– |
0
(0.00%) |
– |
0
(0.00%) |
– |
| Total | 24131 | 100% | 16479 | 100% | 7461 | 100% |
|
| 0 4 5 6 7 16 17 18 28 29 30 40 41 42 52 53 54 64 65 66 67 76 77 78 88 89 90 100 101 102 103 112 113 114 124 125 126 136 137 138 |
|
5137, 3215, 2474, 2295, 353
2038, 1430, 1160, 980, 216 |
 |
| 0 4 5 6 7 16 17 18 28 29 30 40 41 42 52 53 54 64 65 66 67 76 77 78 88 89 90 100 101 102 103 112 113 114 124 125 126 136 137 138 |
|
3537, 2041, 1598, 1477, 215
1496, 895, 729, 615, 130 |
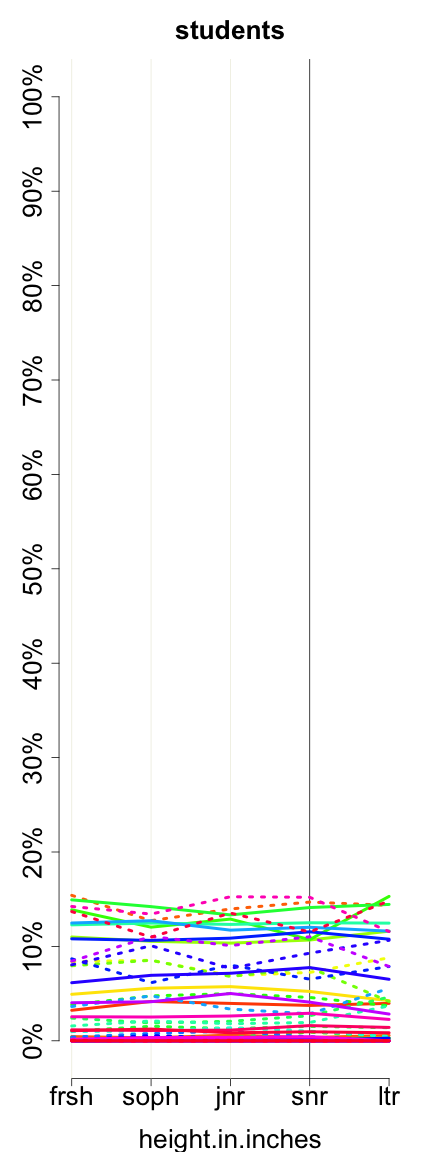
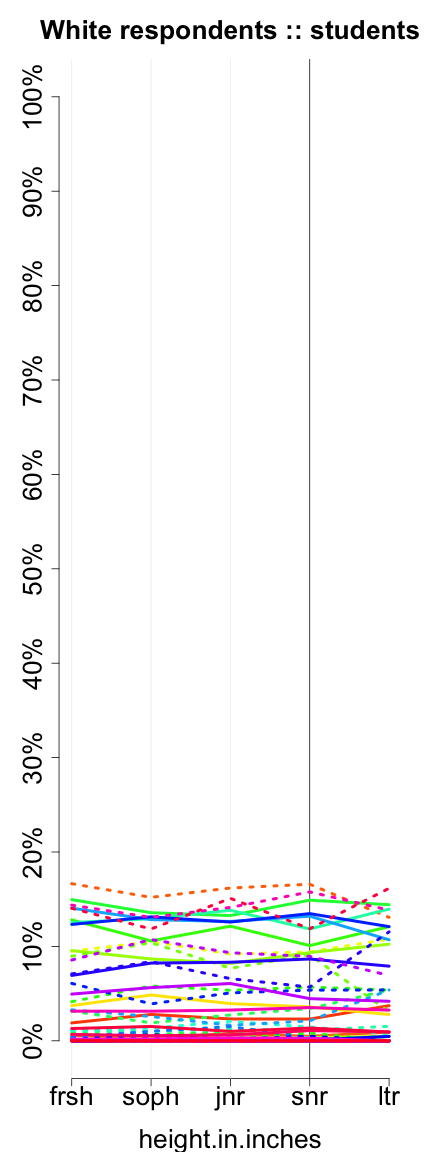
These graphs reflect only undergraduates attending 4-year colleges who are of normative age -- 18, 19, 20, 21, or 22, +/- 1, for freshman, sophomores, juniors, seniors, and later undergraduates, respectively. Solid lines represent women. Dotted lines represent men.
Previous column:
weight.in.pounds
Next column:
physattr
Previous alphabetically:
had.vaginal.intercourse
Next alphabetically:
heroin