2038, 1430, 1160, 980, 216
By Column: Everything | Demographics | Sexual History | Attitudes | Relationships | Dating | Hookups
Alphabetically: Everything | Demographics | Sexual History | Attitudes | Relationships | Dating | Hookups
gpa.c (in Demographics)
| Variable Summary | Undergrad | Freshman | Sophomore | Junior | Senior |
| Sexually active students: | Undergrad | Freshman | Sophomore | Junior | Senior |
| Casual-sexually active students: | Undergrad | Freshman | Sophomore | Junior | Senior |
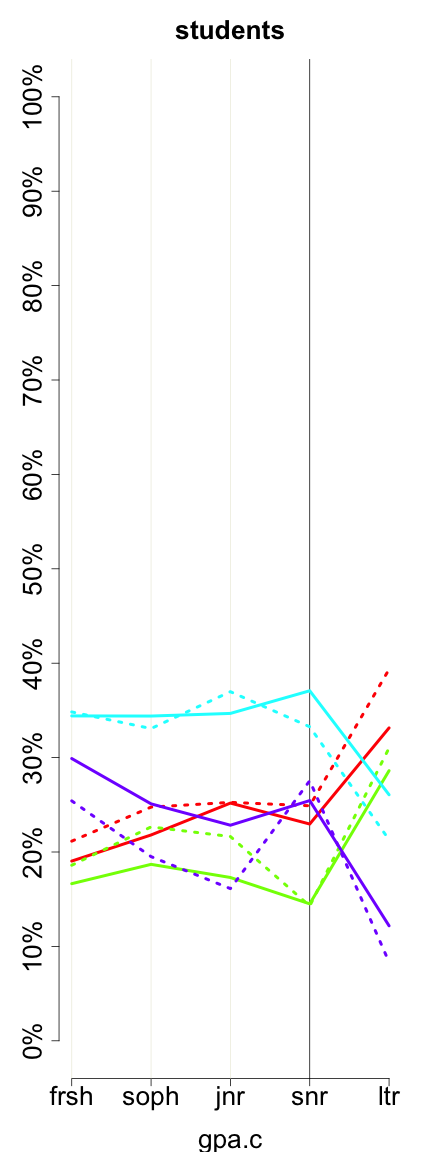
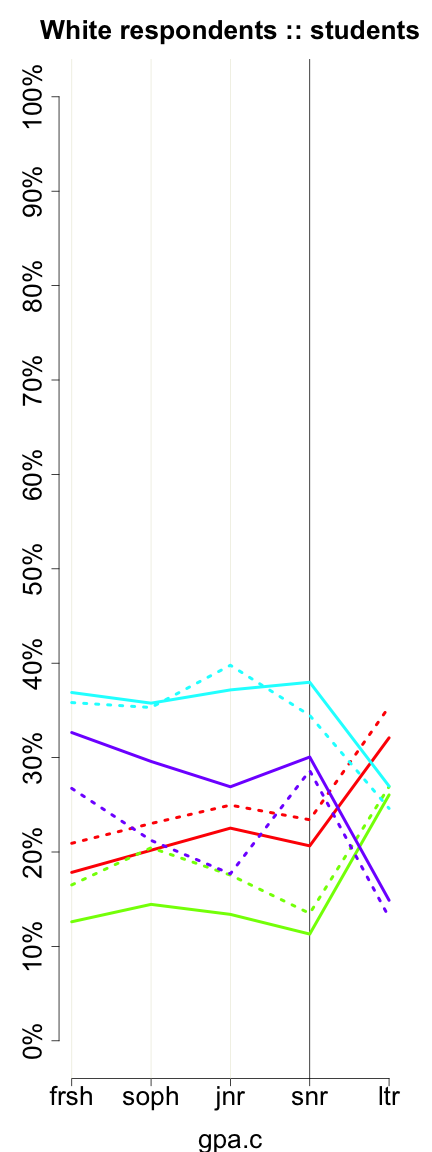
This variable collapses gpa into fewer categories, for regressions that are easier to read and also for larger cell sizes.
This variable, gpa.c, is constructed using information from the variable, gpa.
| students (gpa_c) | ||||||
| All Rs | Female | Male | ||||
| 2.51-3 | 5503 | 22.82% | 3648 | 22.14% | 1843 | 24.70% |
| 2.5 or less | 4572 | 18.96% | 2929 | 17.77% | 1529 | 20.49% |
| 3.01-3.5 | 8067 | 33.46% | 5587 | 33.90% | 2455 | 32.90% |
| 3.51+ | 5969 | 24.76% | 4315 | 26.18% | 1634 | 21.90% |
| Missing |
20
(0.08%) |
– |
0
(0.00%) |
– |
0
(0.00%) |
– |
| Total | 24131 | 100% | 16479 | 100% | 7461 | 100% |
|
| 2.51-3 2.5 or less 3.01-3.5 3.51+ |
|
5137, 3215, 2474, 2295, 353
2038, 1430, 1160, 980, 216 |
 |
| 2.51-3 2.5 or less 3.01-3.5 3.51+ |
|
3537, 2041, 1598, 1477, 215
1496, 895, 729, 615, 130 |
These graphs reflect only undergraduates attending 4-year colleges who are of normative age -- 18, 19, 20, 21, or 22, +/- 1, for freshman, sophomores, juniors, seniors, and later undergraduates, respectively. Solid lines represent women. Dotted lines represent men.