2038, 1430, 1160, 980, 216
By Column: Everything | Demographics | Sexual History | Attitudes | Relationships | Dating | Hookups
Alphabetically: Everything | Demographics | Sexual History | Attitudes | Relationships | Dating | Hookups
dates.since.started.college (in Demographics)
| Variable Summary | Undergrad | Freshman | Sophomore | Junior | Senior |
| Sexually active students: | Undergrad | Freshman | Sophomore | Junior | Senior |
| Casual-sexually active students: | Undergrad | Freshman | Sophomore | Junior | Senior |
This variable sums greek and other dates, but note that these two original variables from the questionnaire were both capped at 15.
This variable, dates.since.started.college, is constructed using information from the variables, dates.greek and dates.not.greek.
| students (dates_since_started_college) | ||||||
| All Rs | Female | Male | ||||
| Mean (Std. Dev.) | 3.45 (5.07) | 3.10 (4.57) | 4.26 (5.98) | |||
| 0 | 9623 | 39.91% | 6753 | 40.98% | 2754 | 36.91% |
| 1 | 2231 | 9.25% | 1651 | 10.02% | 573 | 7.68% |
| 2 | 2450 | 10.16% | 1705 | 10.35% | 738 | 9.89% |
| 3 | 1999 | 8.29% | 1407 | 8.54% | 581 | 7.79% |
| 4 | 1475 | 6.12% | 1045 | 6.34% | 425 | 5.70% |
| 5 | 1406 | 5.83% | 935 | 5.67% | 464 | 6.22% |
| 6 | 817 | 3.39% | 518 | 3.14% | 294 | 3.94% |
| 7 | 628 | 2.60% | 408 | 2.48% | 220 | 2.95% |
| 8 | 498 | 2.07% | 325 | 1.97% | 172 | 2.31% |
| 9 | 257 | 1.07% | 172 | 1.04% | 83 | 1.11% |
| 10 | 605 | 2.51% | 368 | 2.23% | 235 | 3.15% |
| 11 | 223 | 0.92% | 145 | 0.88% | 75 | 1.01% |
| 12 | 211 | 0.88% | 130 | 0.79% | 81 | 1.09% |
| 13 | 146 | 0.61% | 93 | 0.56% | 52 | 0.70% |
| 14 | 106 | 0.44% | 67 | 0.41% | 39 | 0.52% |
| 15 | 545 | 2.26% | 313 | 1.90% | 231 | 3.10% |
| 16 | 103 | 0.43% | 62 | 0.38% | 41 | 0.55% |
| 17 | 131 | 0.54% | 77 | 0.47% | 54 | 0.72% |
| 18 | 109 | 0.45% | 60 | 0.36% | 48 | 0.64% |
| 19 | 64 | 0.27% | 32 | 0.19% | 32 | 0.43% |
| 20 | 137 | 0.57% | 64 | 0.39% | 72 | 0.97% |
| 21 | 37 | 0.15% | 19 | 0.12% | 18 | 0.24% |
| 22 | 47 | 0.19% | 19 | 0.12% | 28 | 0.38% |
| 23 | 21 | 0.09% | 11 | 0.07% | 10 | 0.13% |
| 24 | 5 | 0.02% | 3 | 0.02% | 2 | 0.03% |
| 25 | 82 | 0.34% | 42 | 0.25% | 40 | 0.54% |
| 26 | 3 | 0.01% | 1 | 0.01% | 2 | 0.03% |
| 27 | 8 | 0.03% | 4 | 0.02% | 4 | 0.05% |
| 28 | 2 | 0.01% | 2 | 0.01% | 0 | 0.00% |
| 29 | 1 | 0.00% | 1 | 0.01% | 0 | 0.00% |
| 30 | 142 | 0.59% | 47 | 0.29% | 93 | 1.25% |
| Missing |
19
(0.08%) |
– |
0
(0.00%) |
– |
0
(0.00%) |
– |
| Total | 24131 | 100% | 16479 | 100% | 7461 | 100% |
|
| 0 1 2 3 4 5 6 7 8 9 10 11 12 13 14 15 16 17 18 19 20 21 22 23 24 25 26 27 28 29 30 |
|
5137, 3215, 2474, 2295, 353
2038, 1430, 1160, 980, 216 |
 |
| 0 1 2 3 4 5 6 7 8 9 10 11 12 13 14 15 16 17 18 19 20 21 22 23 24 25 26 27 28 29 30 |
|
3537, 2041, 1598, 1477, 215
1496, 895, 729, 615, 130 |
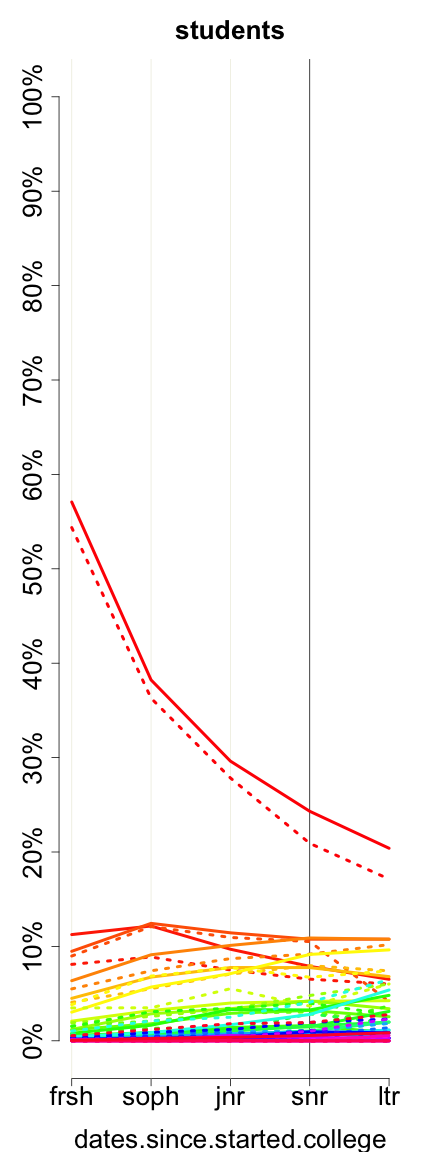
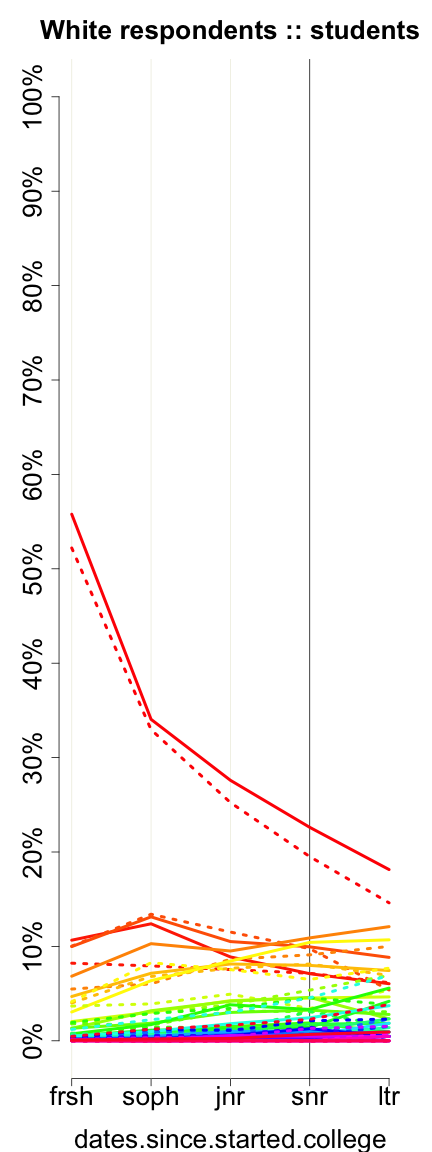
These graphs reflect only undergraduates attending 4-year colleges who are of normative age -- 18, 19, 20, 21, or 22, +/- 1, for freshman, sophomores, juniors, seniors, and later undergraduates, respectively. Solid lines represent women. Dotted lines represent men.
Previous column:
dates.not.greek
Next column:
num.people.asked.out.since.started.college
Previous alphabetically:
dates.not.greek
Next alphabetically:
did.not.know.partner.at.all